Introduction
Welcome to Dynatrace Performance as a Self Service Lab
Today we will cover how performance engineers can leverage Dynatrace thoughtout the CI/CD lifecycle.
During this course you will learn:
- Load Test setup and Analysis
- Dynatrace SLOs
- Integrating Jmeter / Load Test Harness
- Automated Performance testing
- SLI/SLO Dashboards
- Dynatrace Cloud Automation
- Dynatrace Release Monitoring
- Release Analysis
- Keptn
- Jenkins Library for Keptn
- Order Overview
- SockShop
- EasyTravel
- Jmeter Plugin
- KIAB
- Jmeter Service
How can you access your lab instance?
- Access your Dynatrace Tenant, from the Environments tab
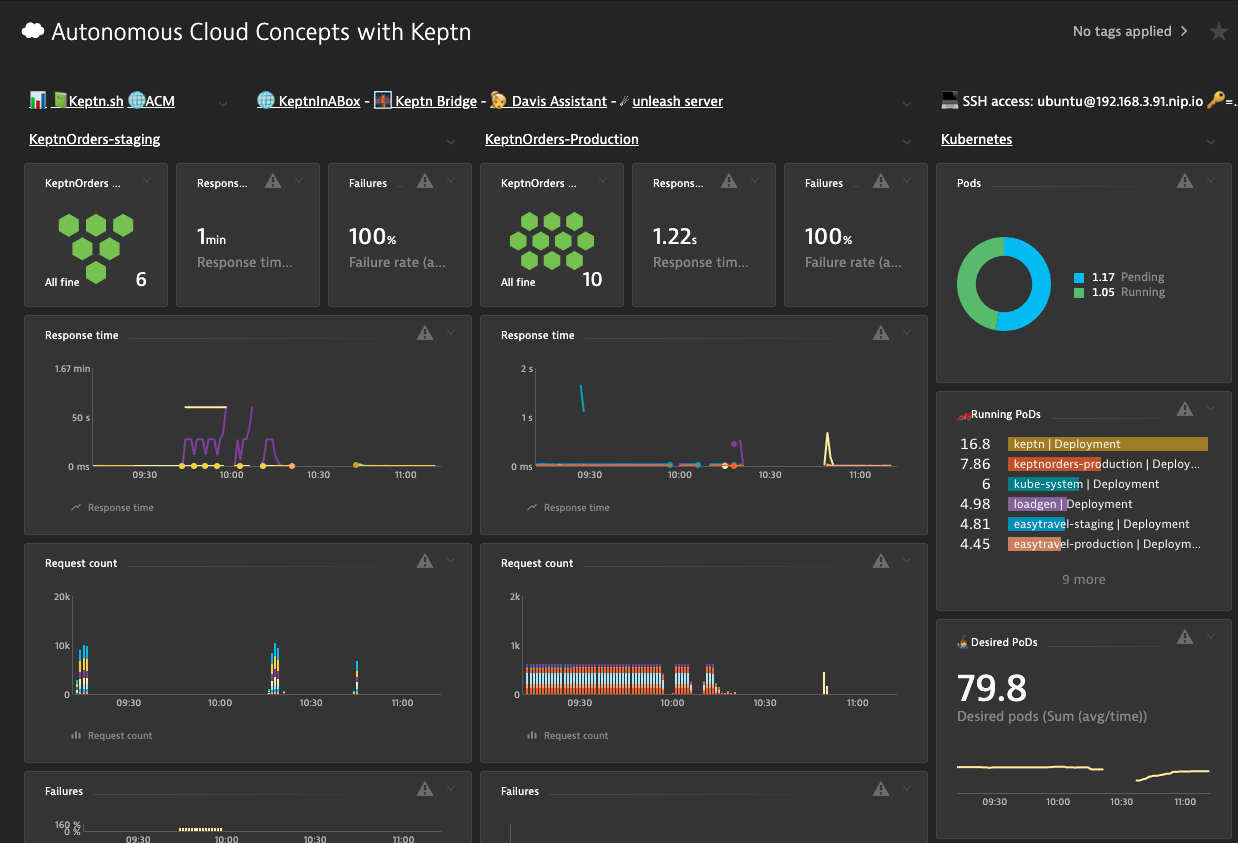
- Go to “Dashboards”
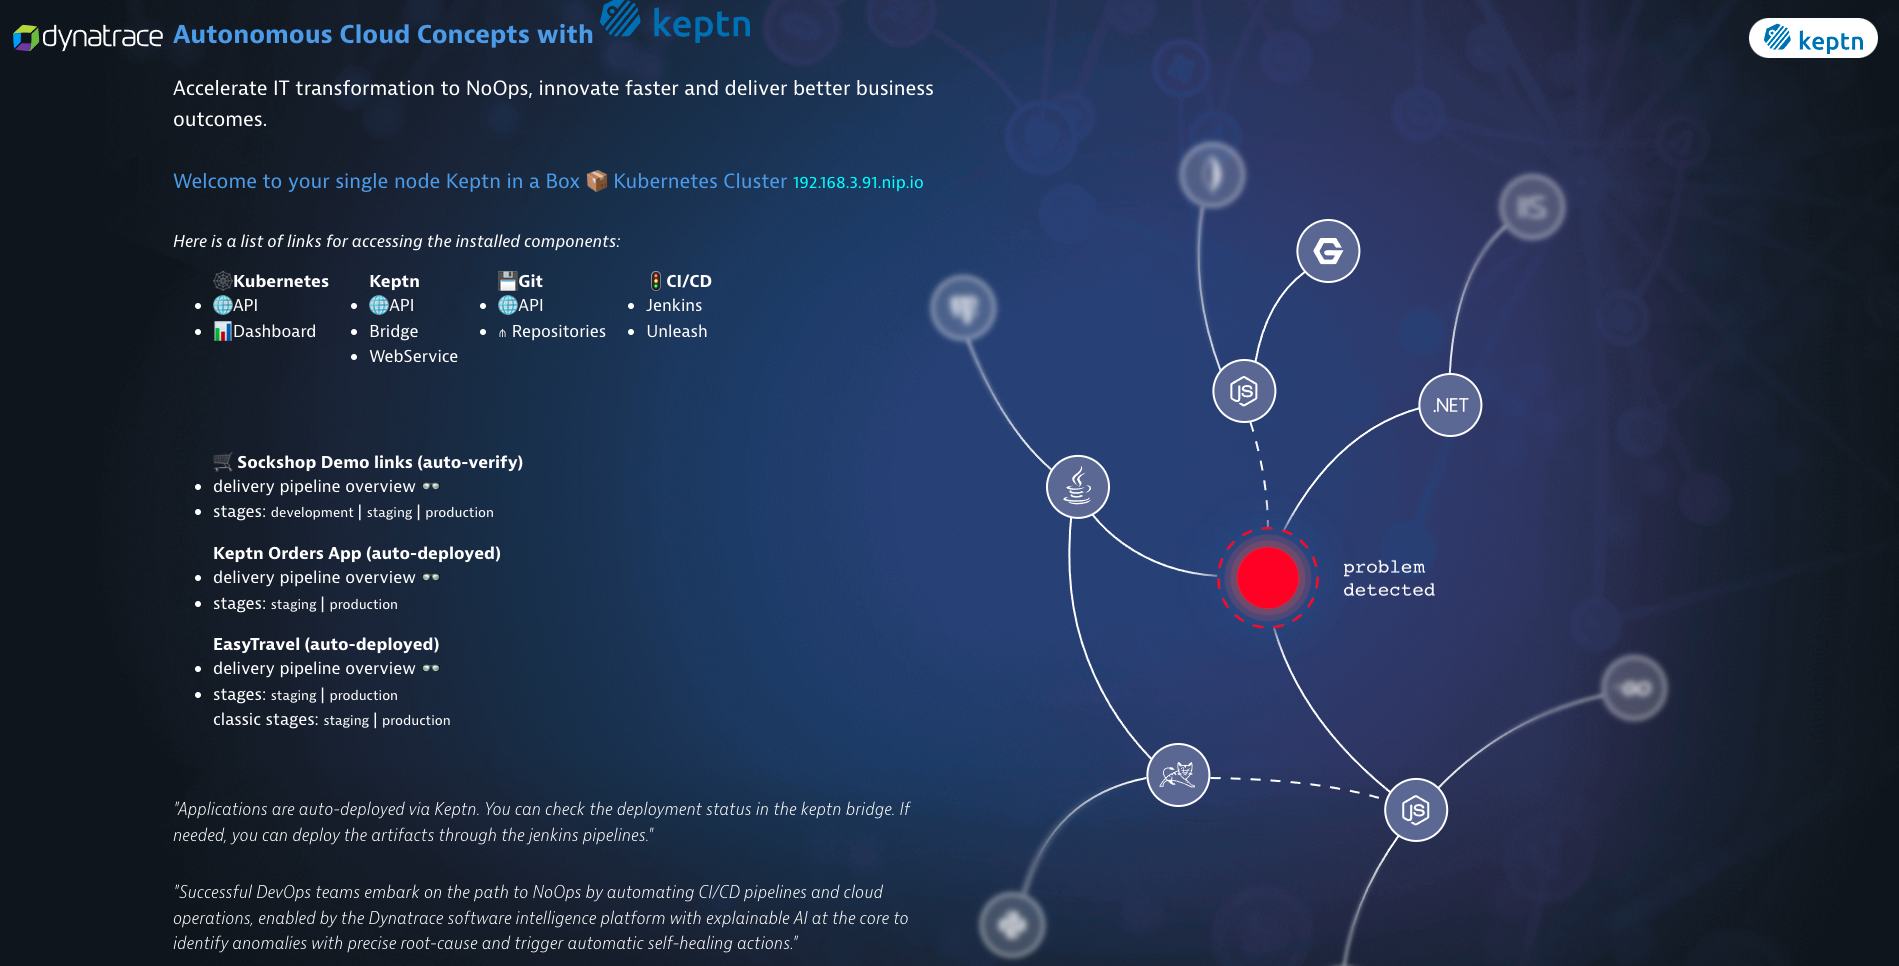
- open the “☁ Autonomous Cloud Concepts with Keptn” Dashboard.
- Select link “🌐 KeptnInABox”
You can also find the ip address to the lab homepage by loggining into your EC2 instance with ssh from the Environments tab.
Then run the following from the command prompt.
#: less +F /tmp/install.log
Get the URL for lab from the log output.
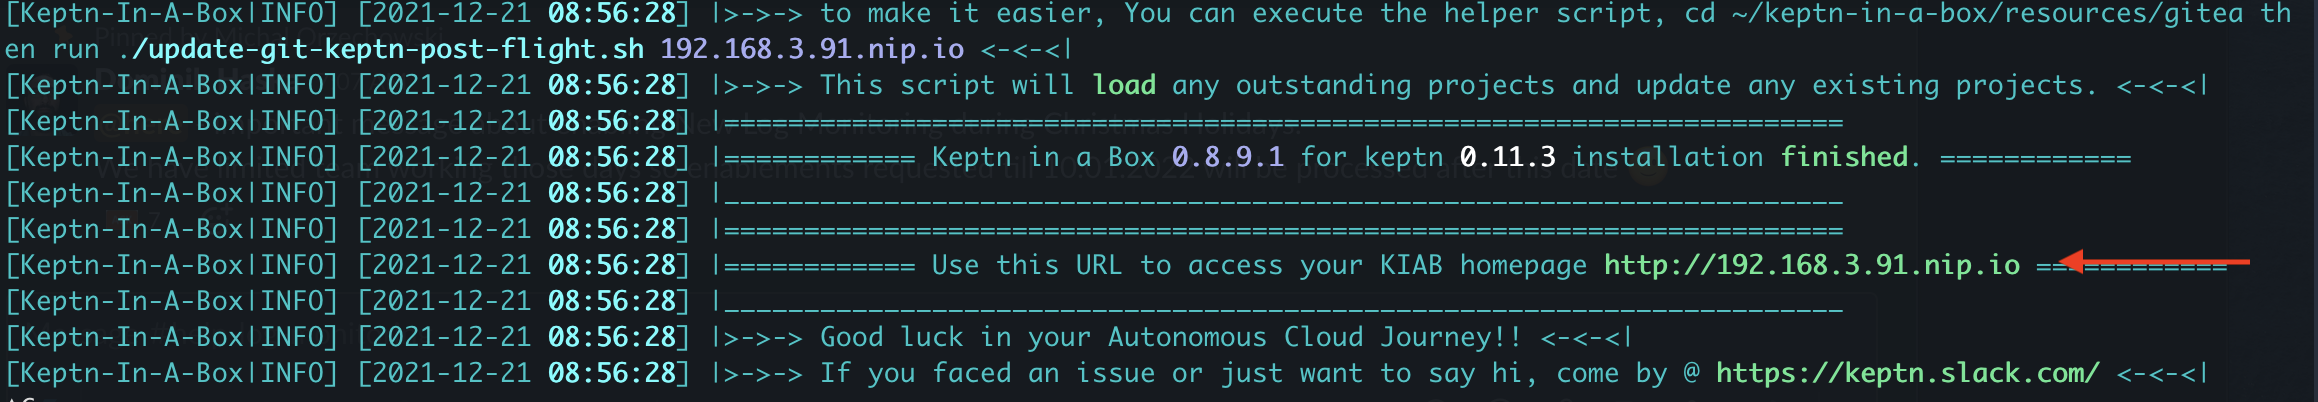
Welcome to KIAB.
Validating the projects in the keptn bridge
Click on the “Bridge” link. This will open the keptn bridge. You should see the preloaded projects.
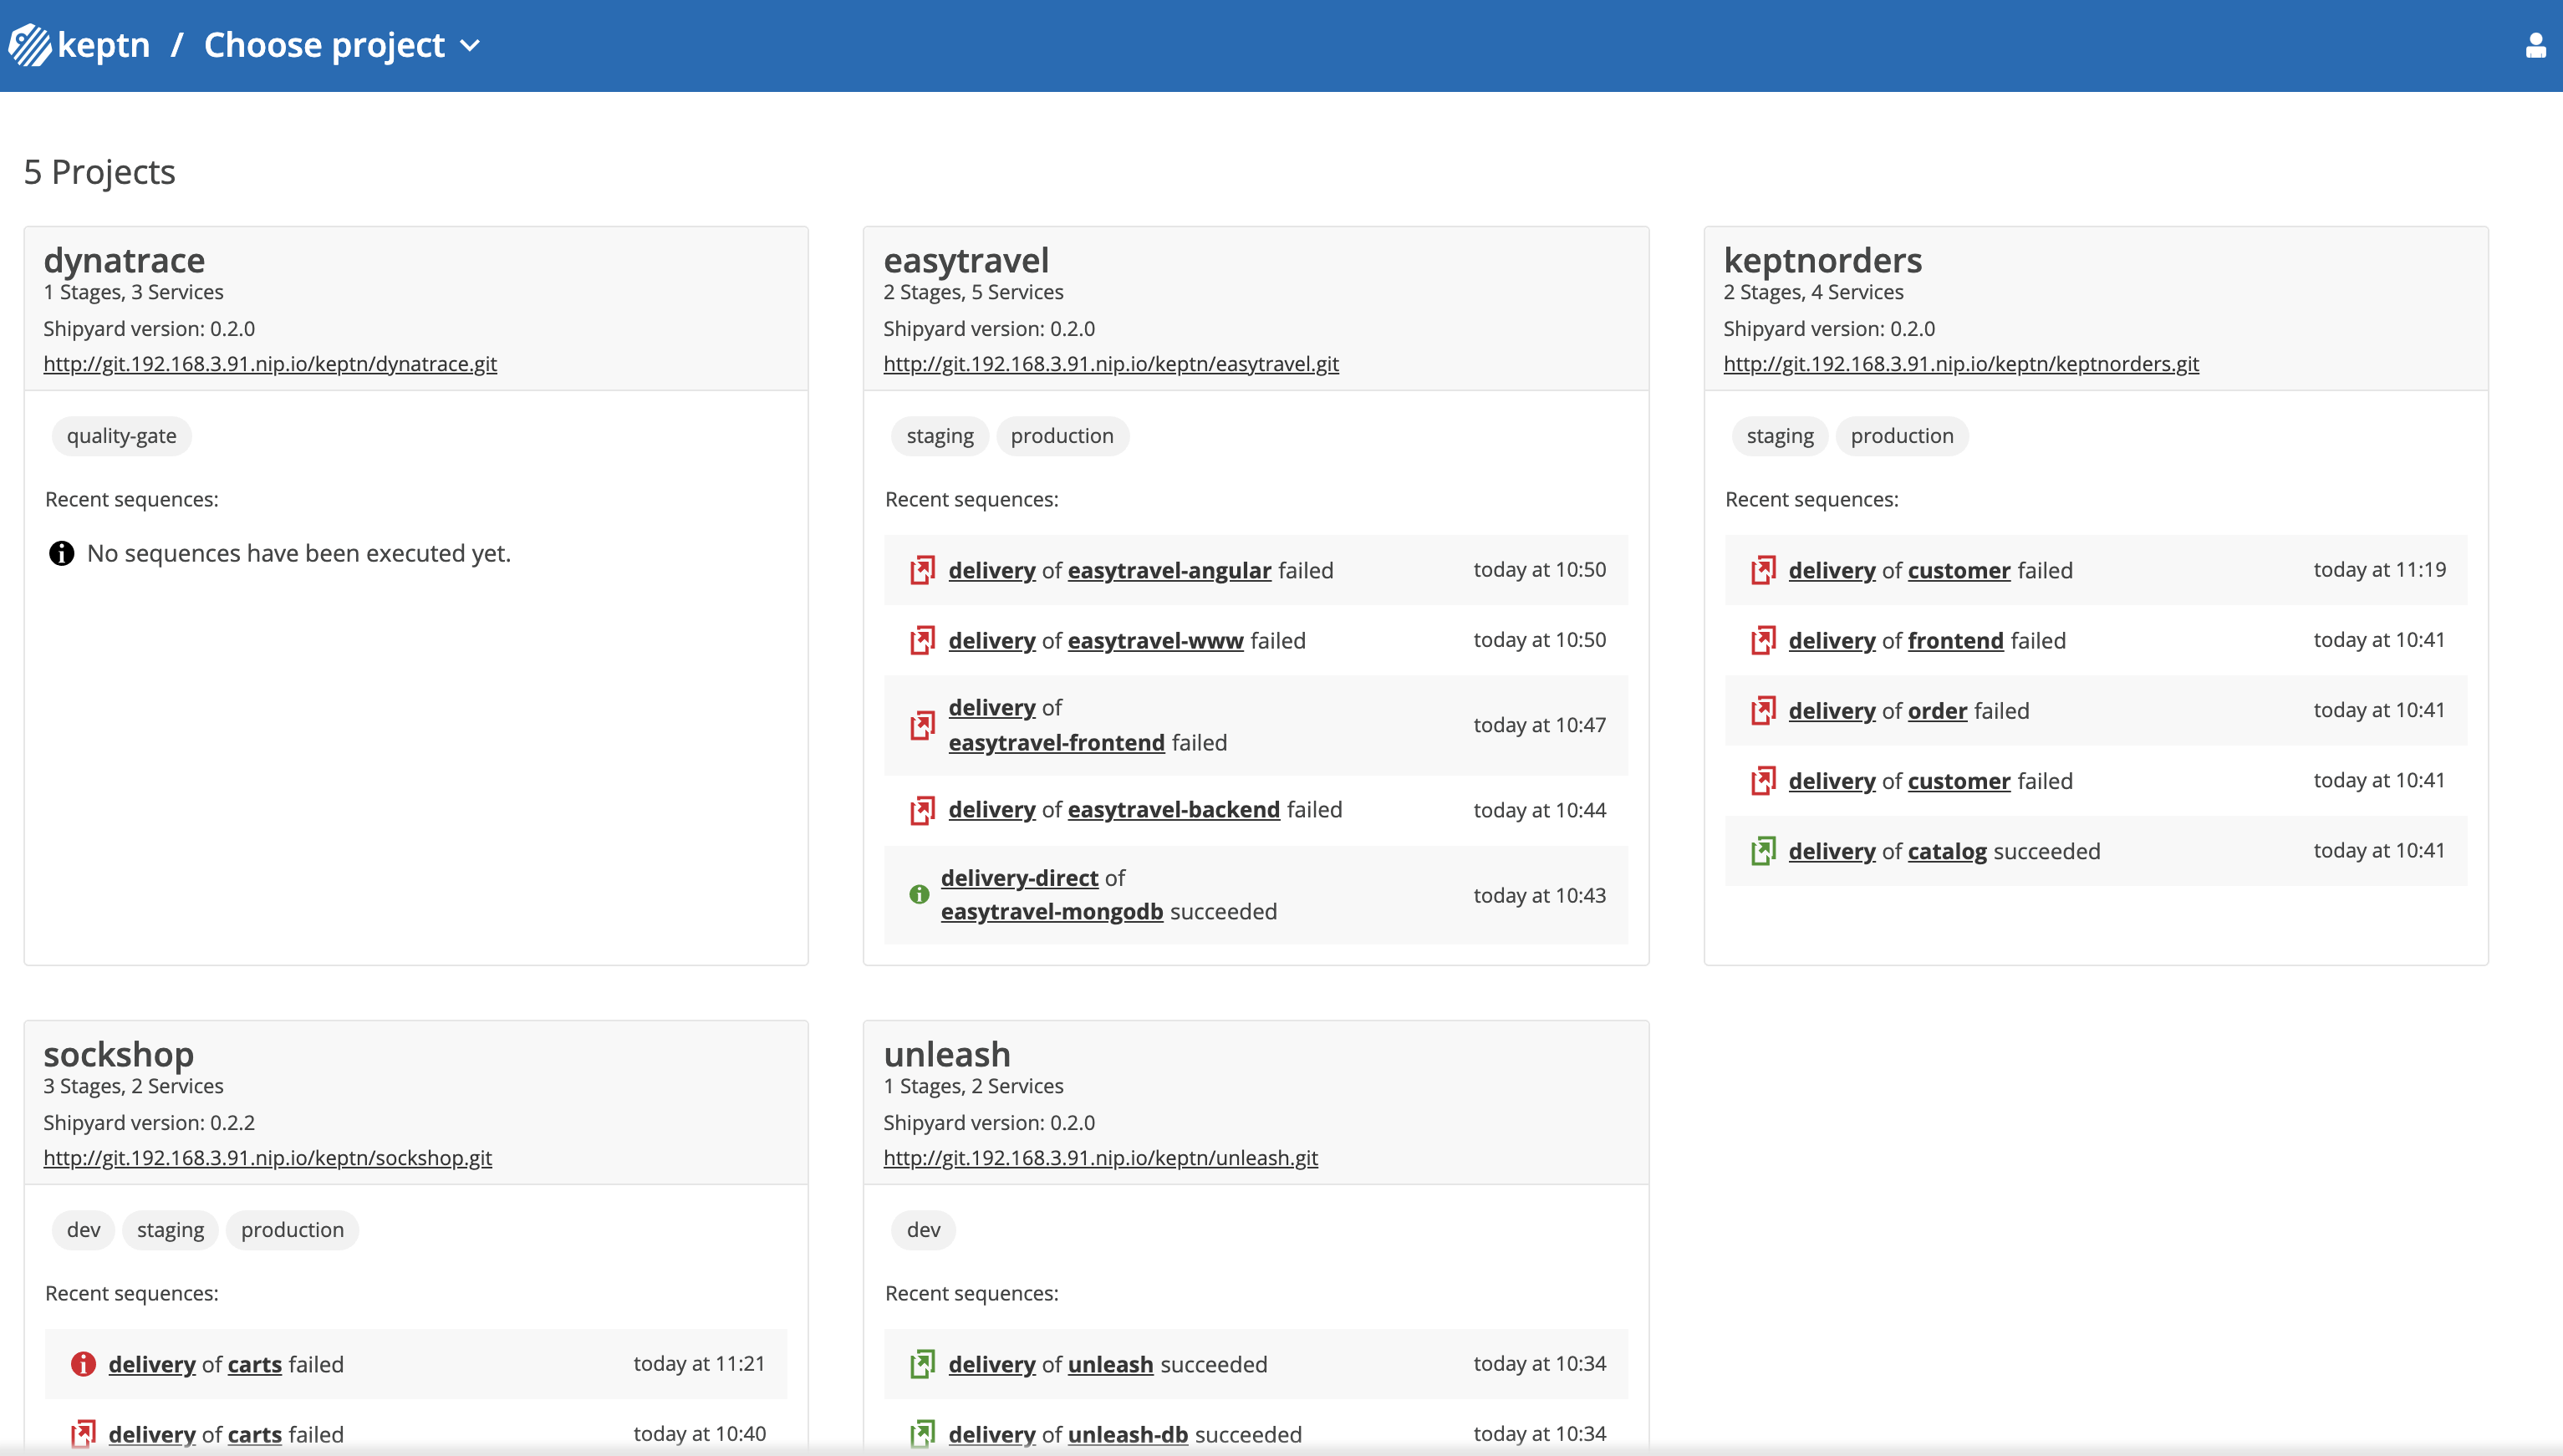
By examining the Bridge, we can determine if we need to trigger a deployment for any of the application services.
You may need to run several pipelines to complete the deployments of the applications but before we do that we need to adjust our dashboard in Dynatrace which contains the critiera some of these tests are checking against.
Validate some Enviornment Settings
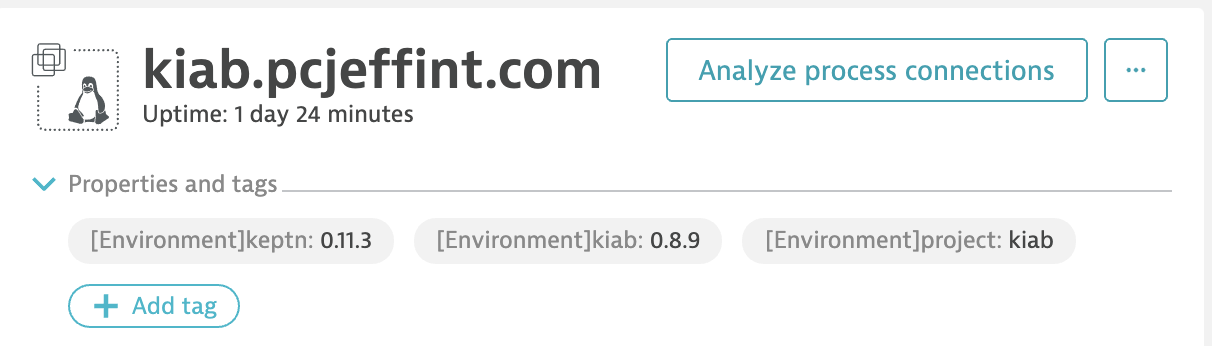
Check the Host is tagged.
You should see these tags,
- Login to your EC2 instance via ssh, from the Environments tab
-
Navigate to “keptn-in-a-box/resources/dynatrace/scripts” directory
#: cd keptn-in-a-box/resources/dynatrace/scripts -
run this command.
#: sudo ./hosttag.shAfter you have run this script, just wait a few minutes, then verify the tags have been added to the host.
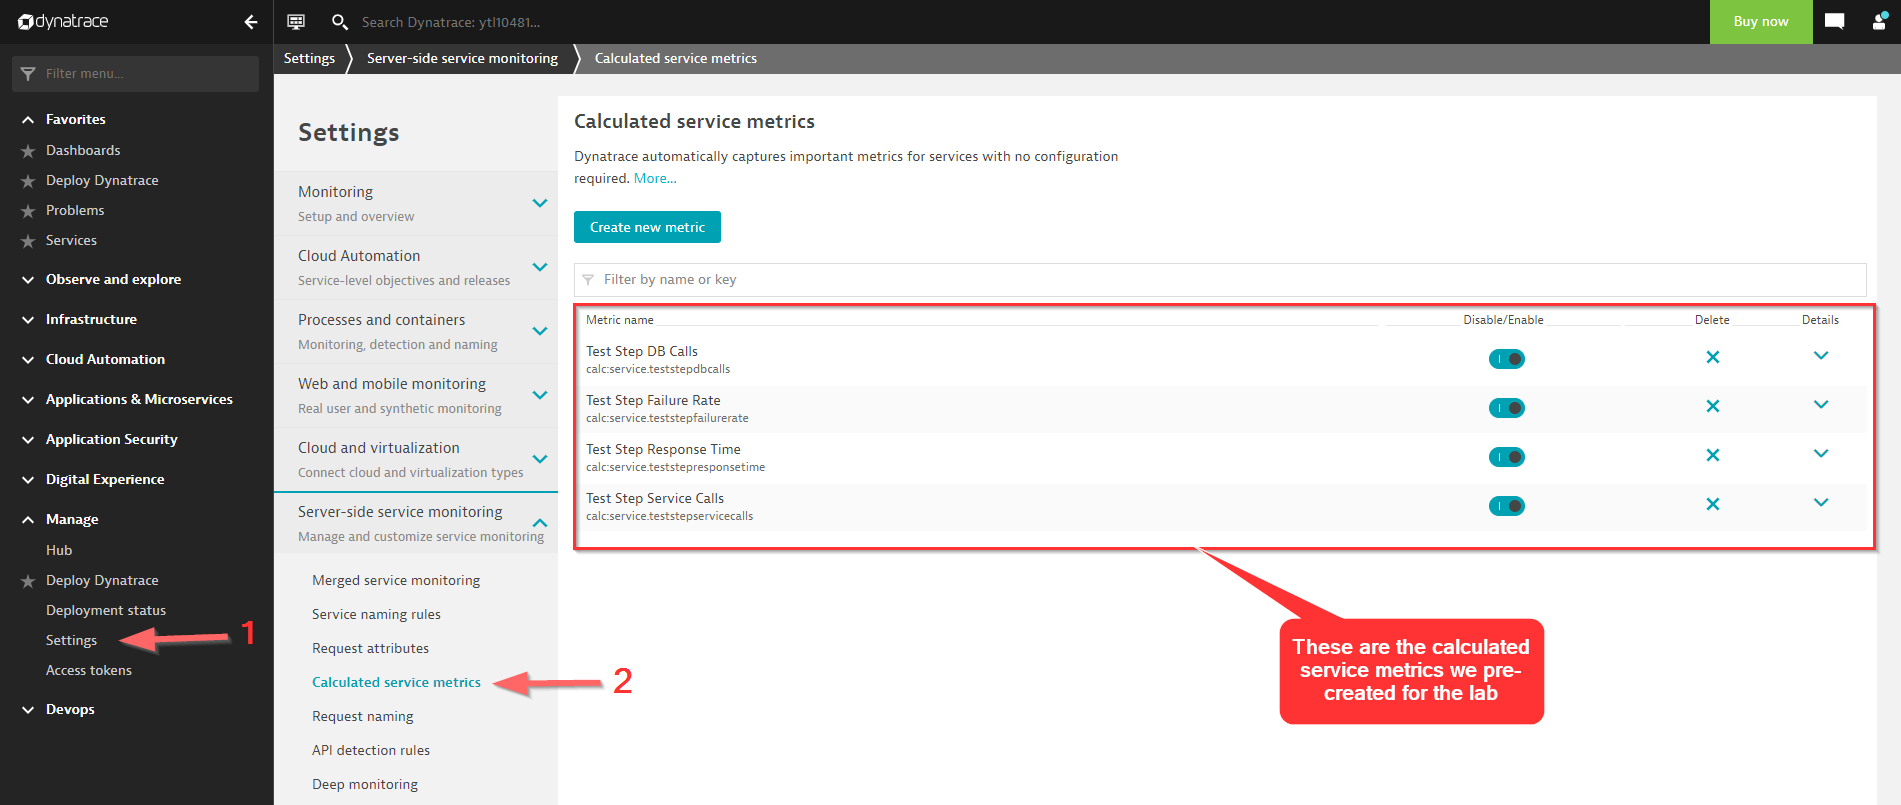
Check Calculated service metrics
Go to Dynatrace.
Navigate to “Settings>Server-side service monitoring>Calculated service metrics”
You should see 4 calculated service Metrics:
- Go to your lab environment tab
- Click open terminal to ssh into your EC2 instance.
- navigate to
#: cd ~/keptn-in-a-box/resources/dynatrace/scripts
- Run the following command
#: sudo ./createTestStepCalculatedMetrics.sh CONTEXTLESS keptn_project simpleproject
Adjust Management zone
We need to add host criteria to the “Keptn: sockshop staging” management zone which will be set as a filter in our dashboard.
Open Dynatrace and navigate to “Settings>Preferences>Management zones”
Find the “Keptn: Sockshop staging” management zone.
We need to add a rule to capture the host and process metrics.
Use these settings to create the Rule.
- Rule Applies to “Hosts”
- Conditions: Host tags equals [Environment]kiab
-
Select checkbox “Apply to processes running on matching hosts
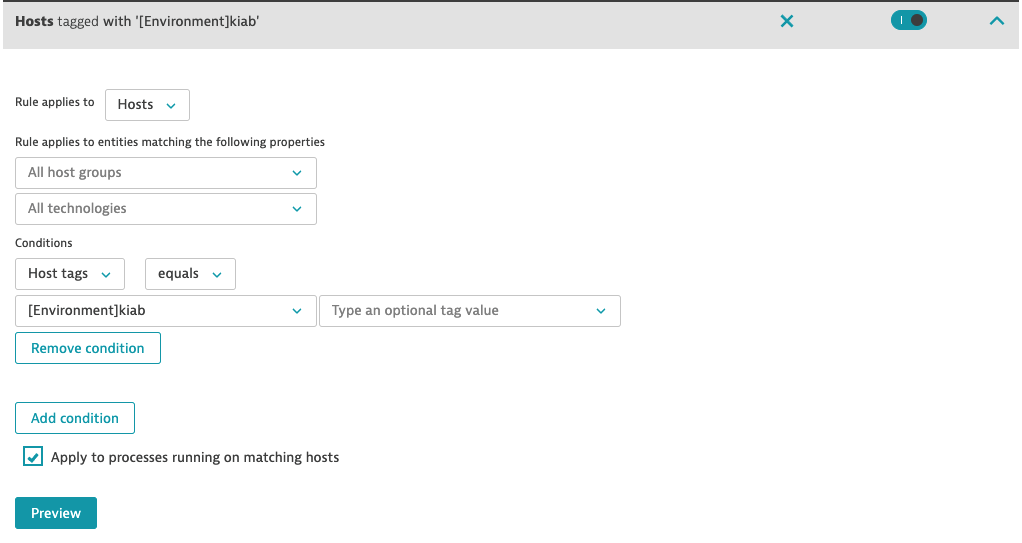
- Click “Preview”
- Click “Create rule”
Clone dashboard and set default management zone
Go to “Dashboards” and open the “KQG;project=sockshop;stage=staging;service=carts” dashbaord.
- Click
...in the top right corner and clickClone - Click “Edit”
- Remove “-cloned” from the title
- Select “Settings”
- Pick “Keptn: sockshop staging” for the Default Managment zone
- Click “Done”
- Validate you see data in each tile
Now we can start running the pipelines in Jenkins that we see failed in the Keptn Bridge…
Runing Jenkins Pipelines
Click on “Jenkins” from the lab homepage
Login to Jenkins with the following credentials
- username = keptn
- password = keptn
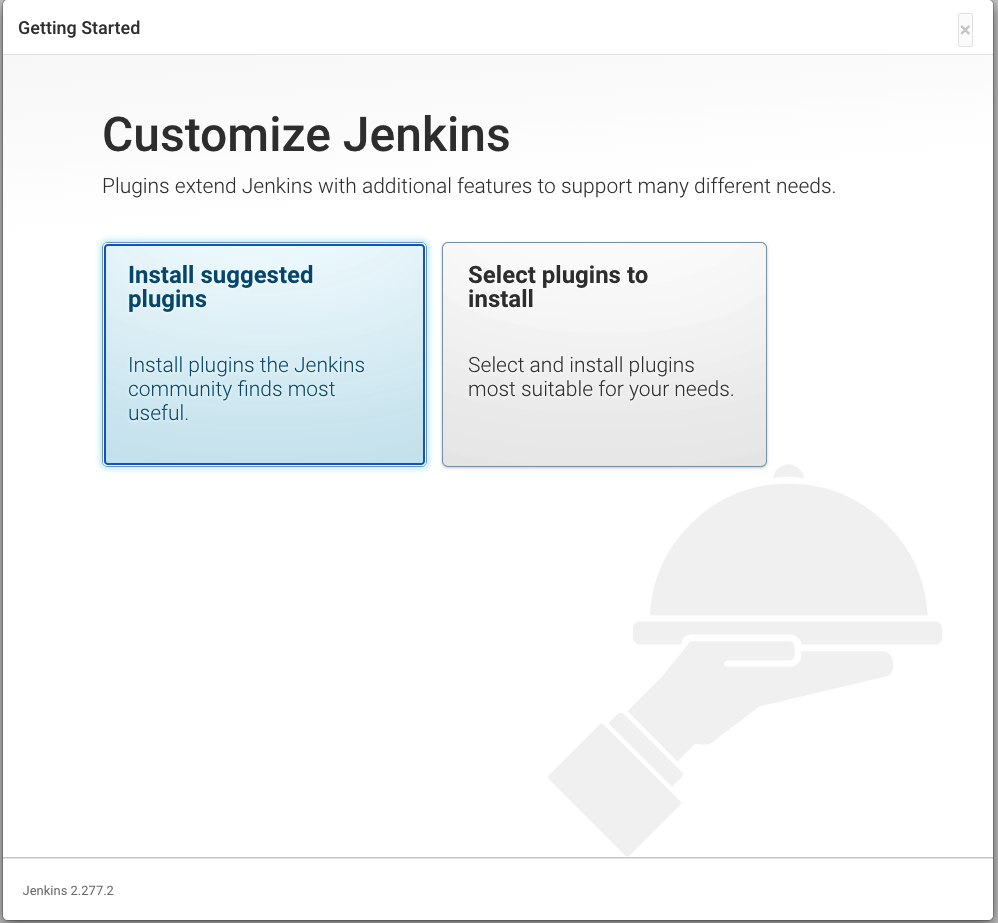
First you will just select “Install Suggested Plugins”
Now we will kick off the Pipeline 01-deploy-order-application to build out the application.
After selecting the pipeline click “build”
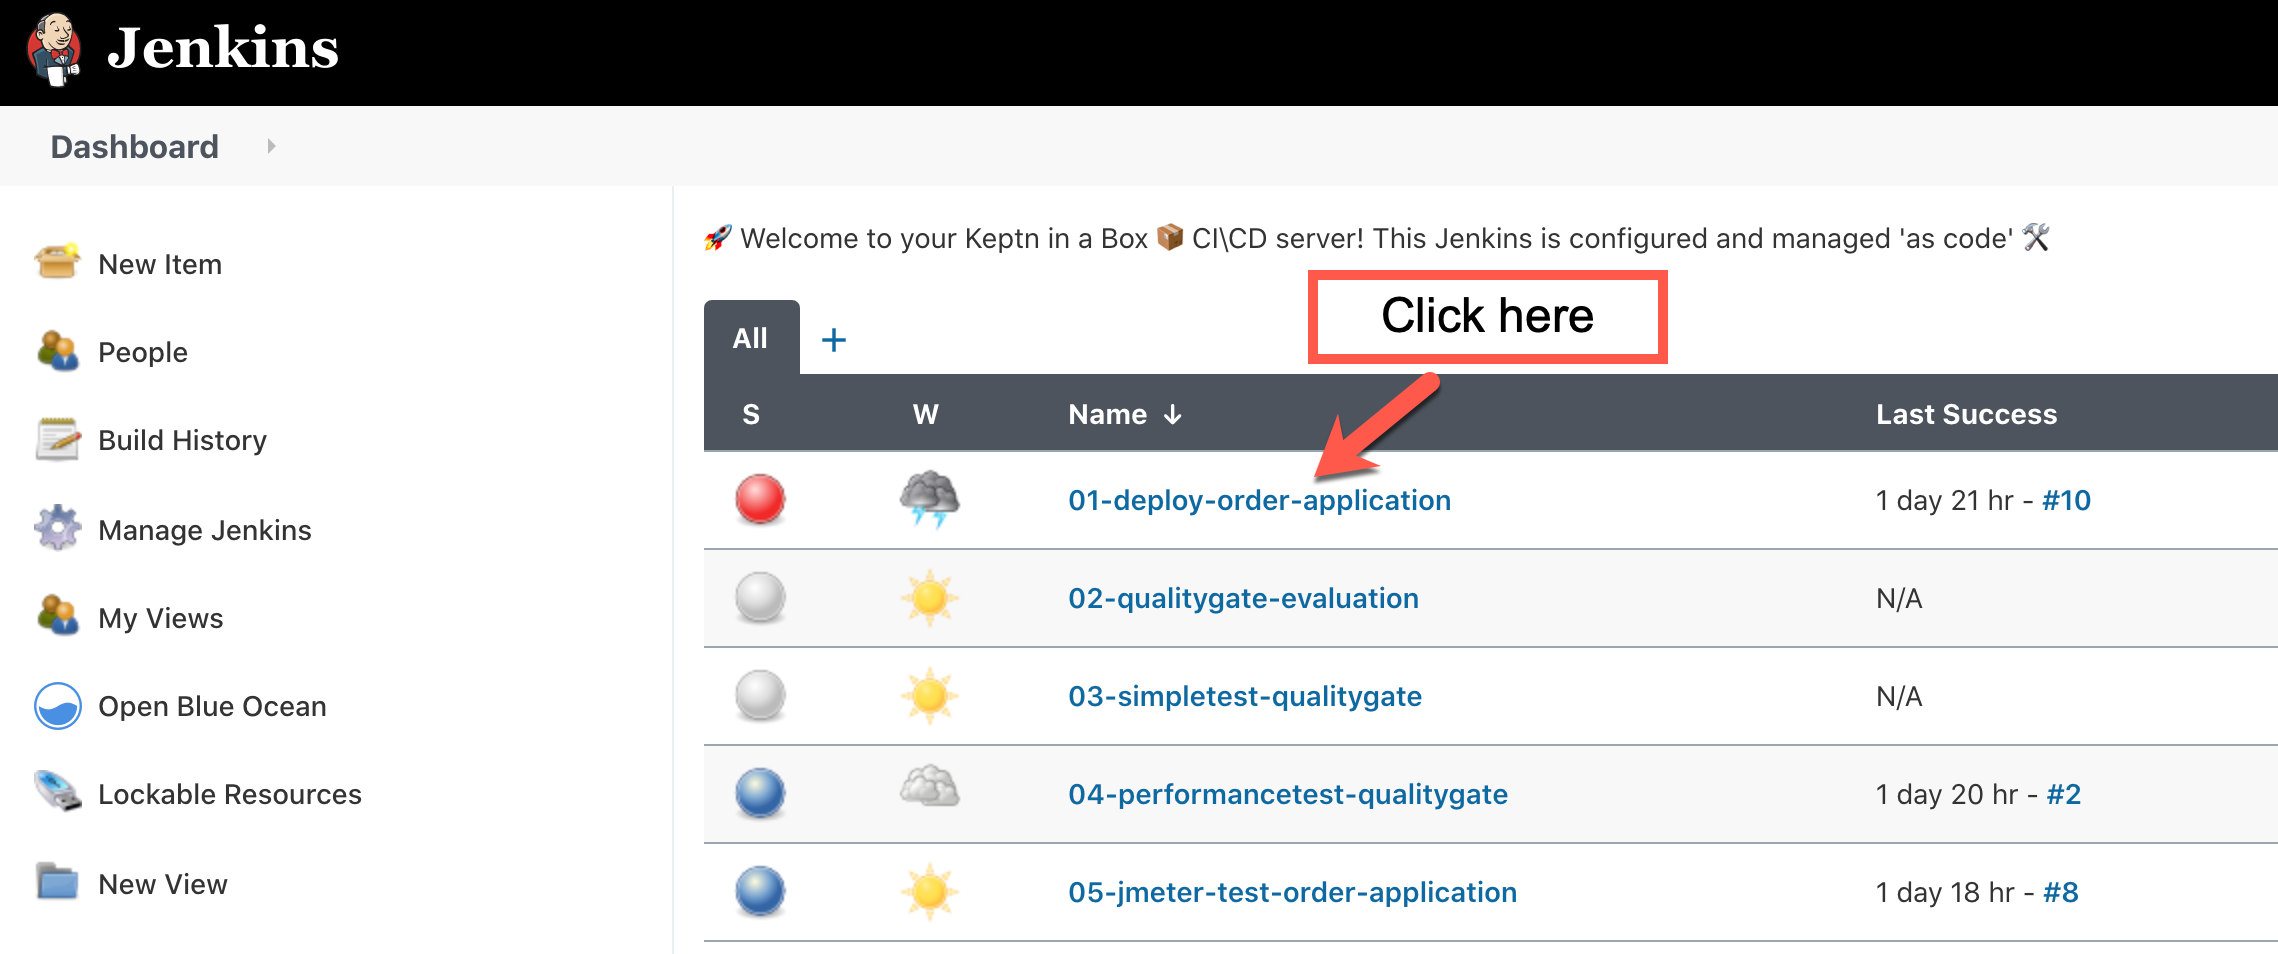
The initial build will fail, this is normal, becasue the pipeline files are pulled from a github repo.
Refresh the page, you should then see “Build with parameters”.
Initially, the “order” service may fail, in the “DEPLOY_TO” option, we can select order. This allows us to deploy only the “order” service.
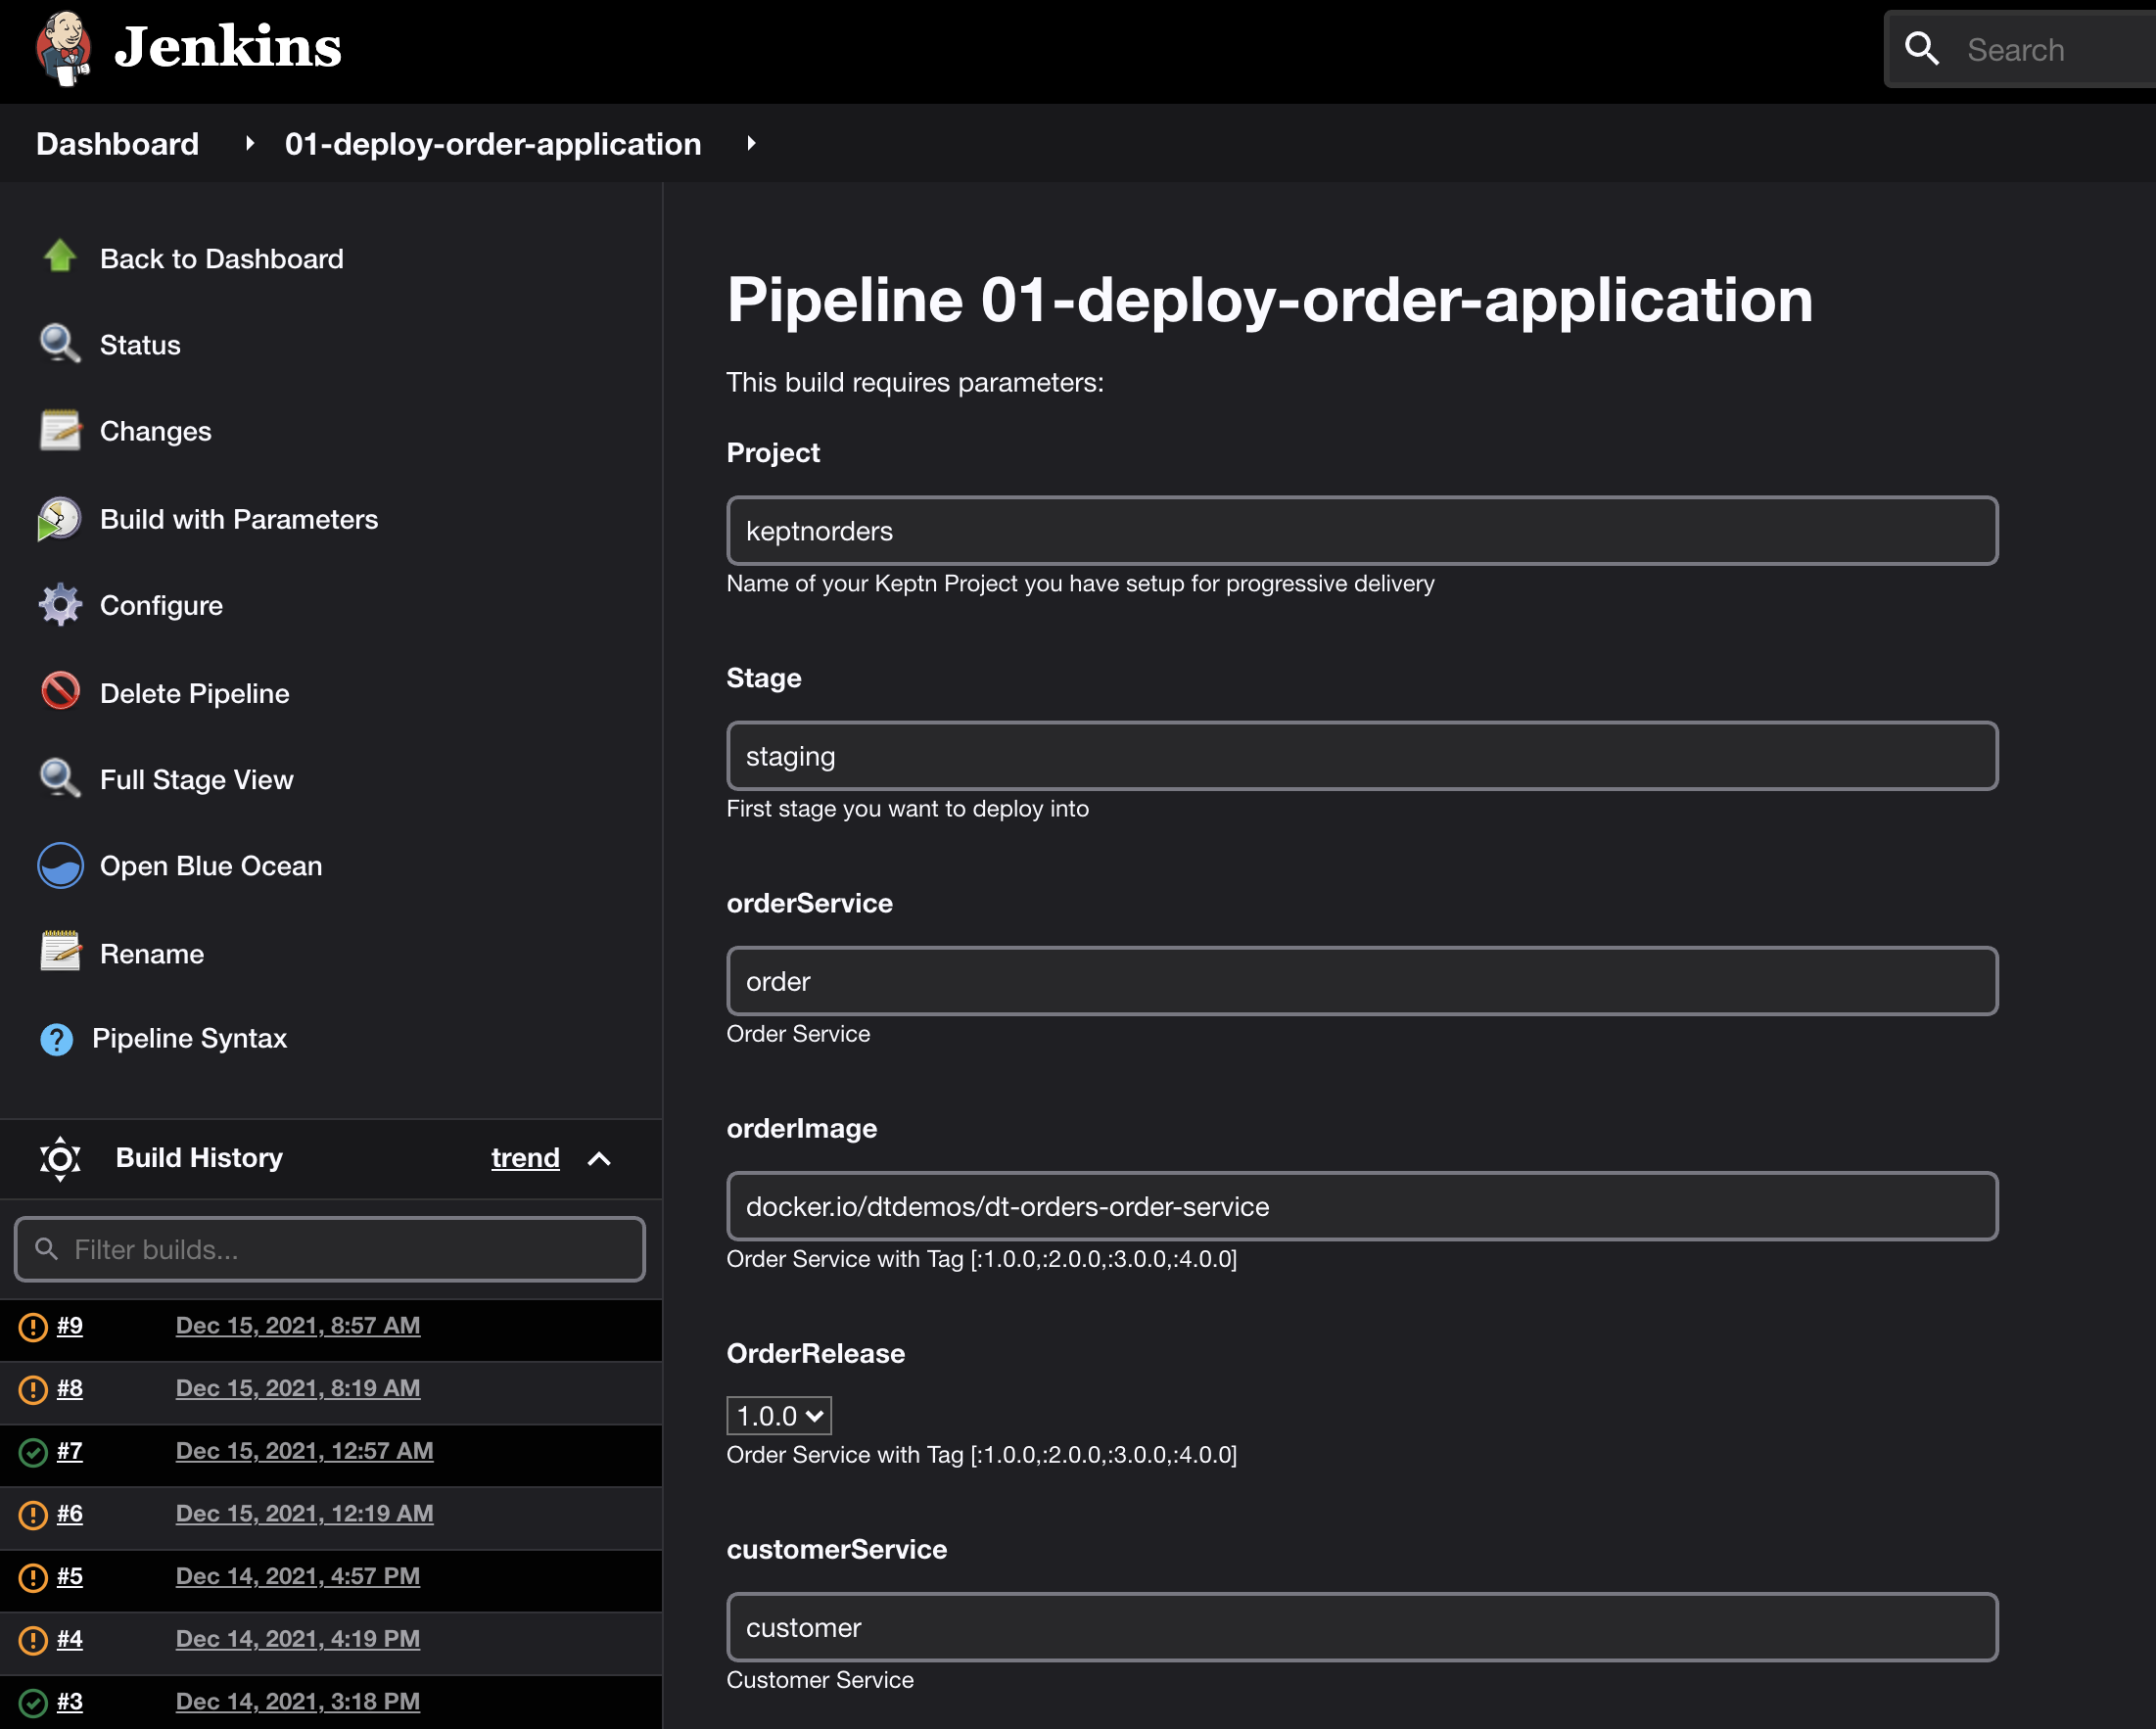
We now have different options for each pipeline build. Instead of documenting each part here, we will walk through a few scenerios.
Validating your Enviornment
Additionally, we may need to deploy additional application services. By examining each project in the Bridge, we can determine which application services need to be deployed.
Let’s take a little time to do this now.
Each Application deploymnet has it’s own pipeline. With the help of an instructor, select the appropriate pipeline and build out the necessary services.
Order App Overview
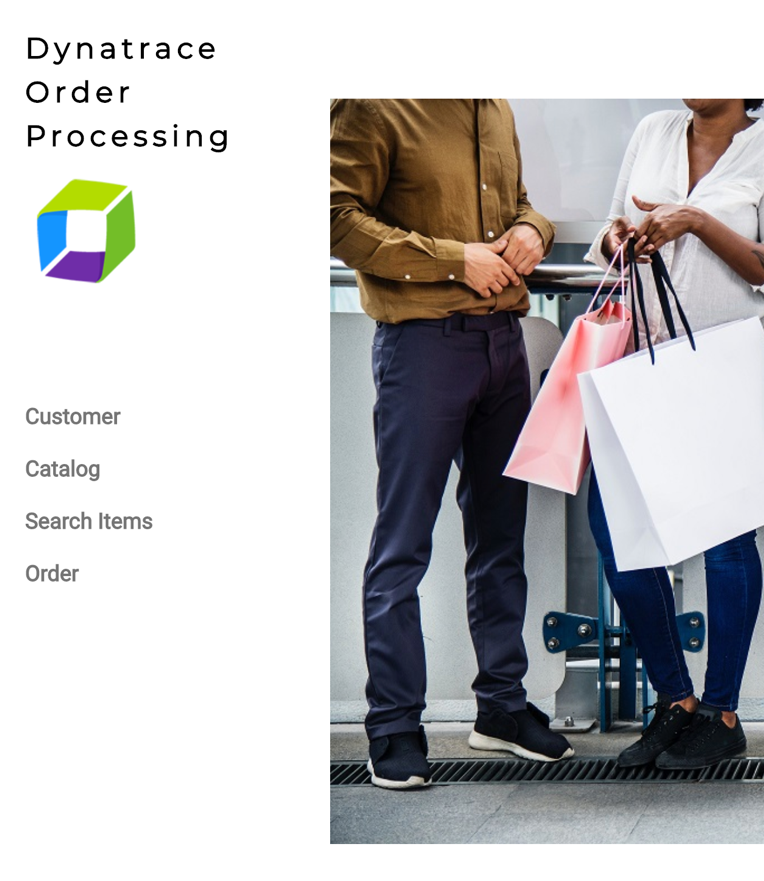
This application was built for demonstations of Dynatrace. Here is the frontend.
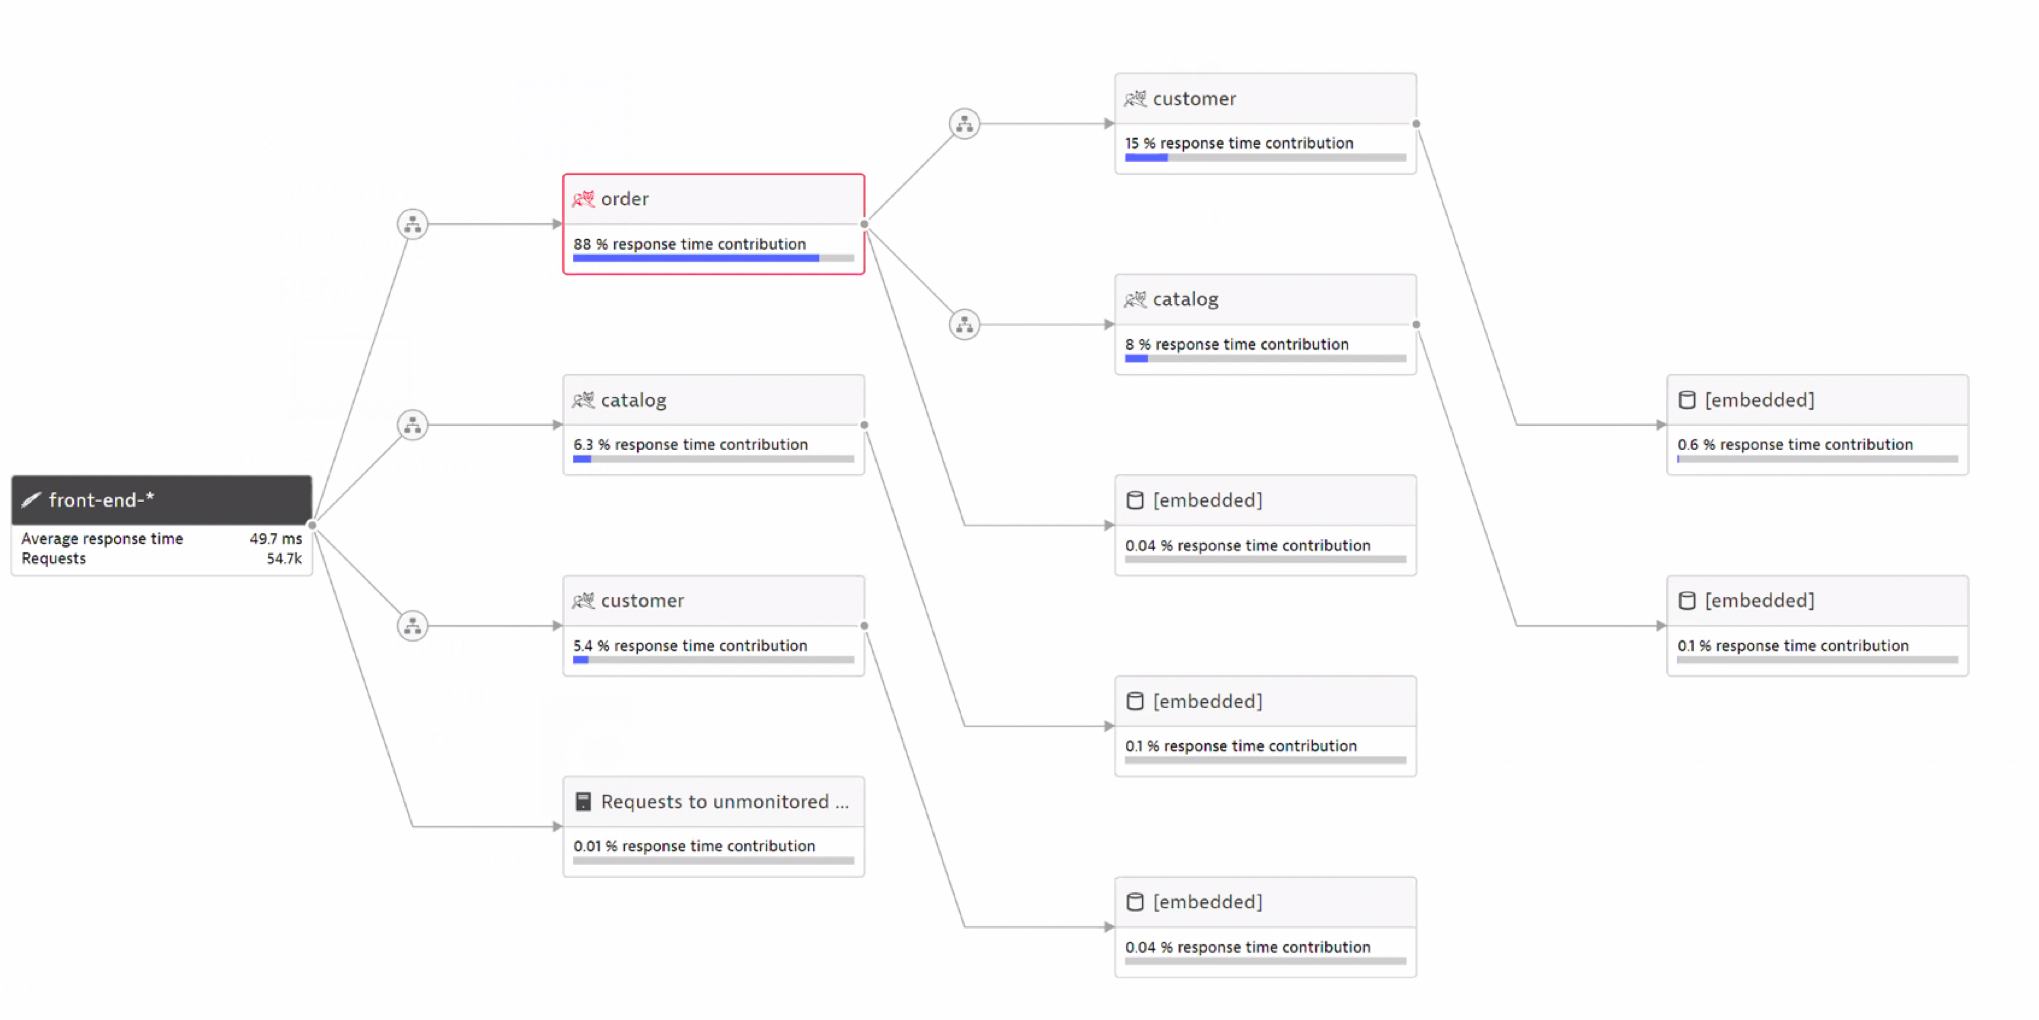
The overall application is made up of four Docker components: a frontend web UI and 3 backend services. Once monitored by Dynatrace, a multi-tier service flow will be available as shown below.
Pre-built Docker Images
The dt-orders application has pre-built problems programmed within different versions. See source in the dt-orders repo. Each version for each service, has pre-built docker images that are published to dockerhub.
This is a summary of the versions followed by a description of the problem scenarios.
| Service | Branch/Docker Tag | Description |
|---|---|---|
| frontend | 1.0.0 | Normal behavior |
| catalog-service | 1.0.0 | Normal behavior |
| customer-service | 1.0.0 | Normal behavior |
| order-service | 1.0.0 | Normal behavior |
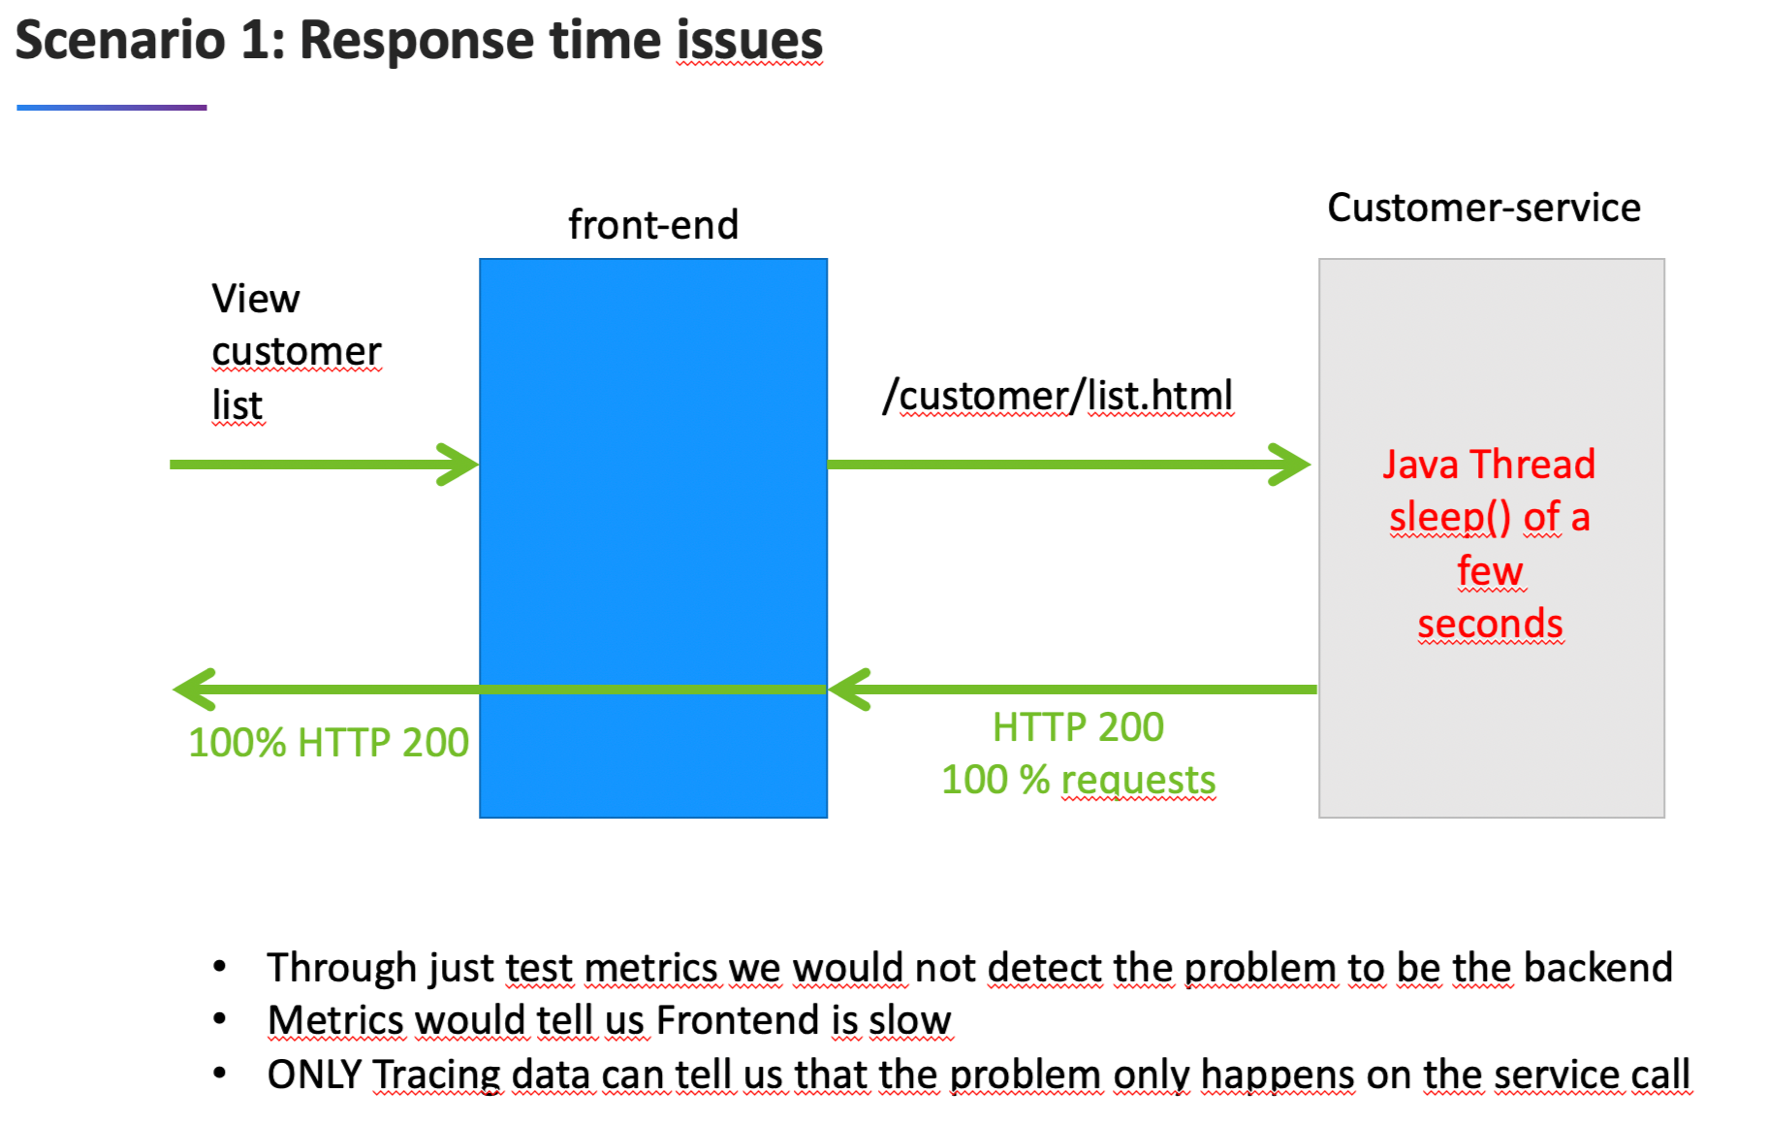
| customer-service | 2.0.0 | High Response time for /customer/list.html |
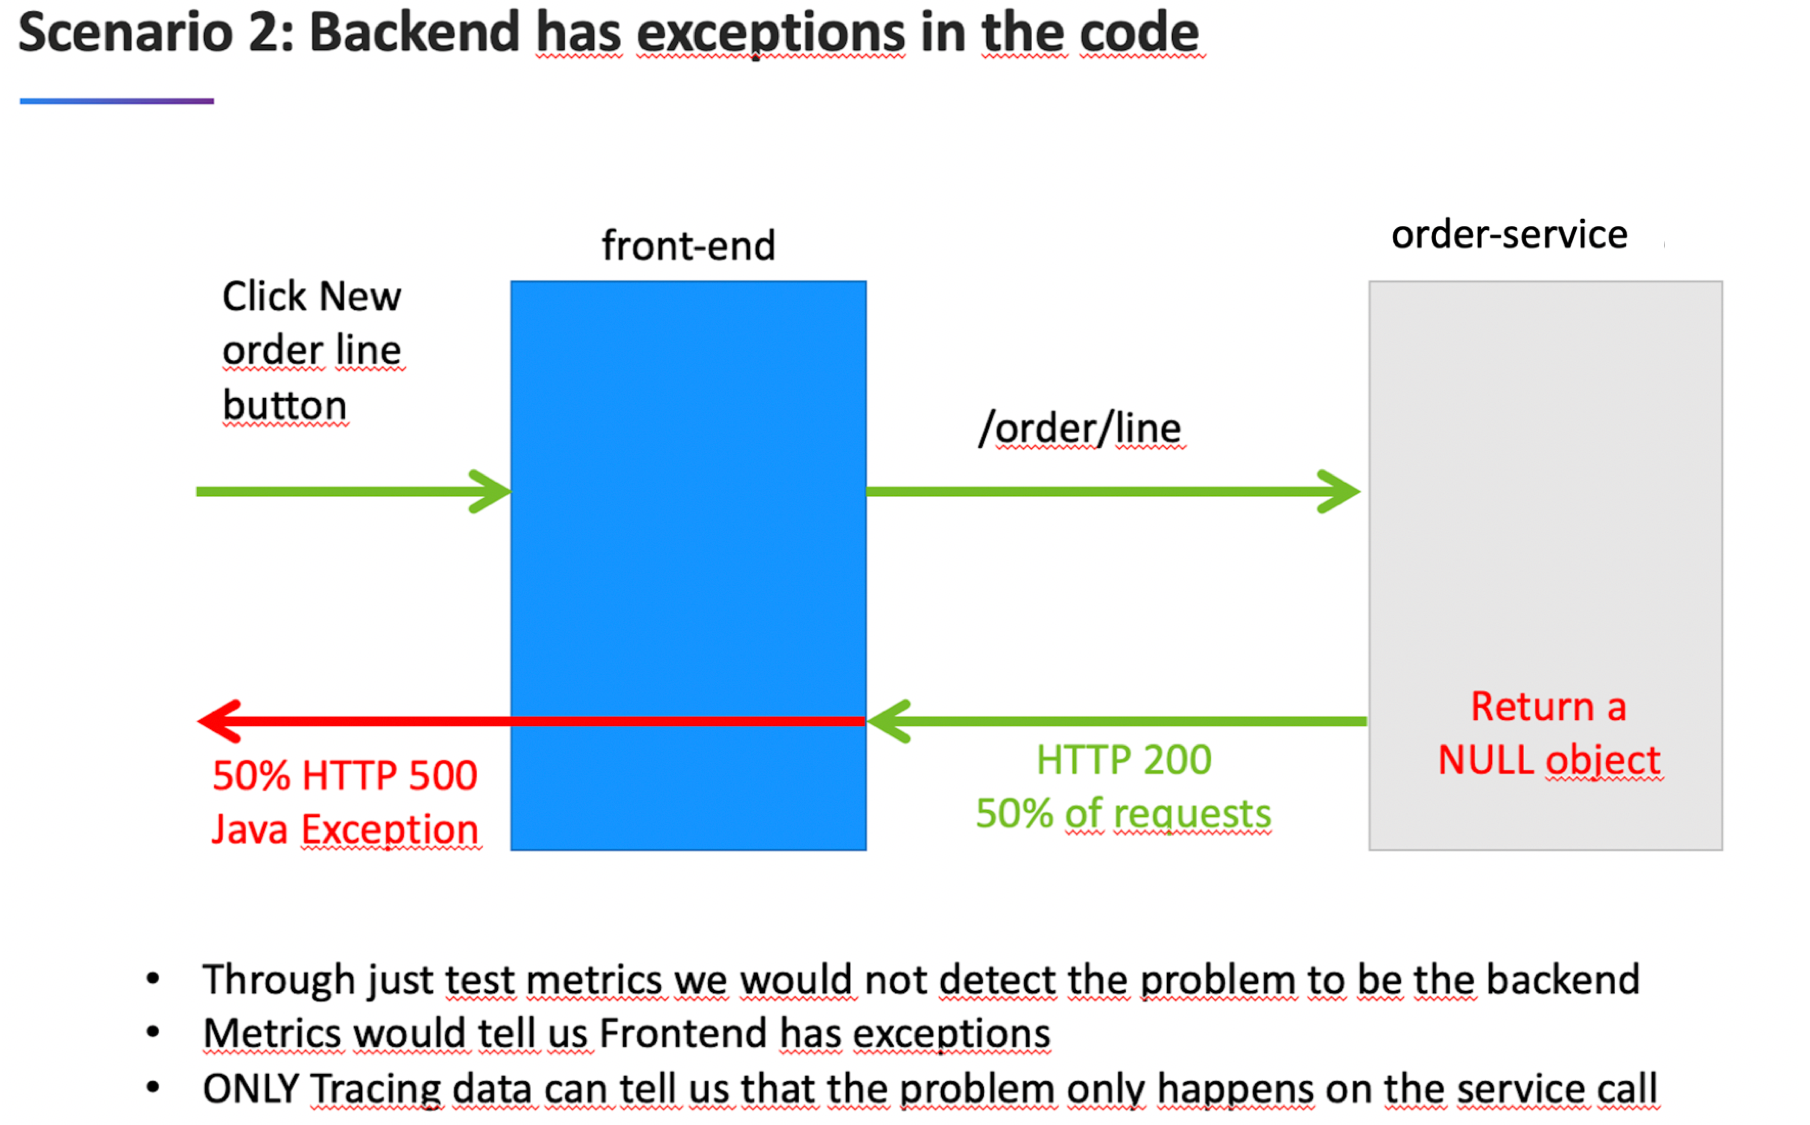
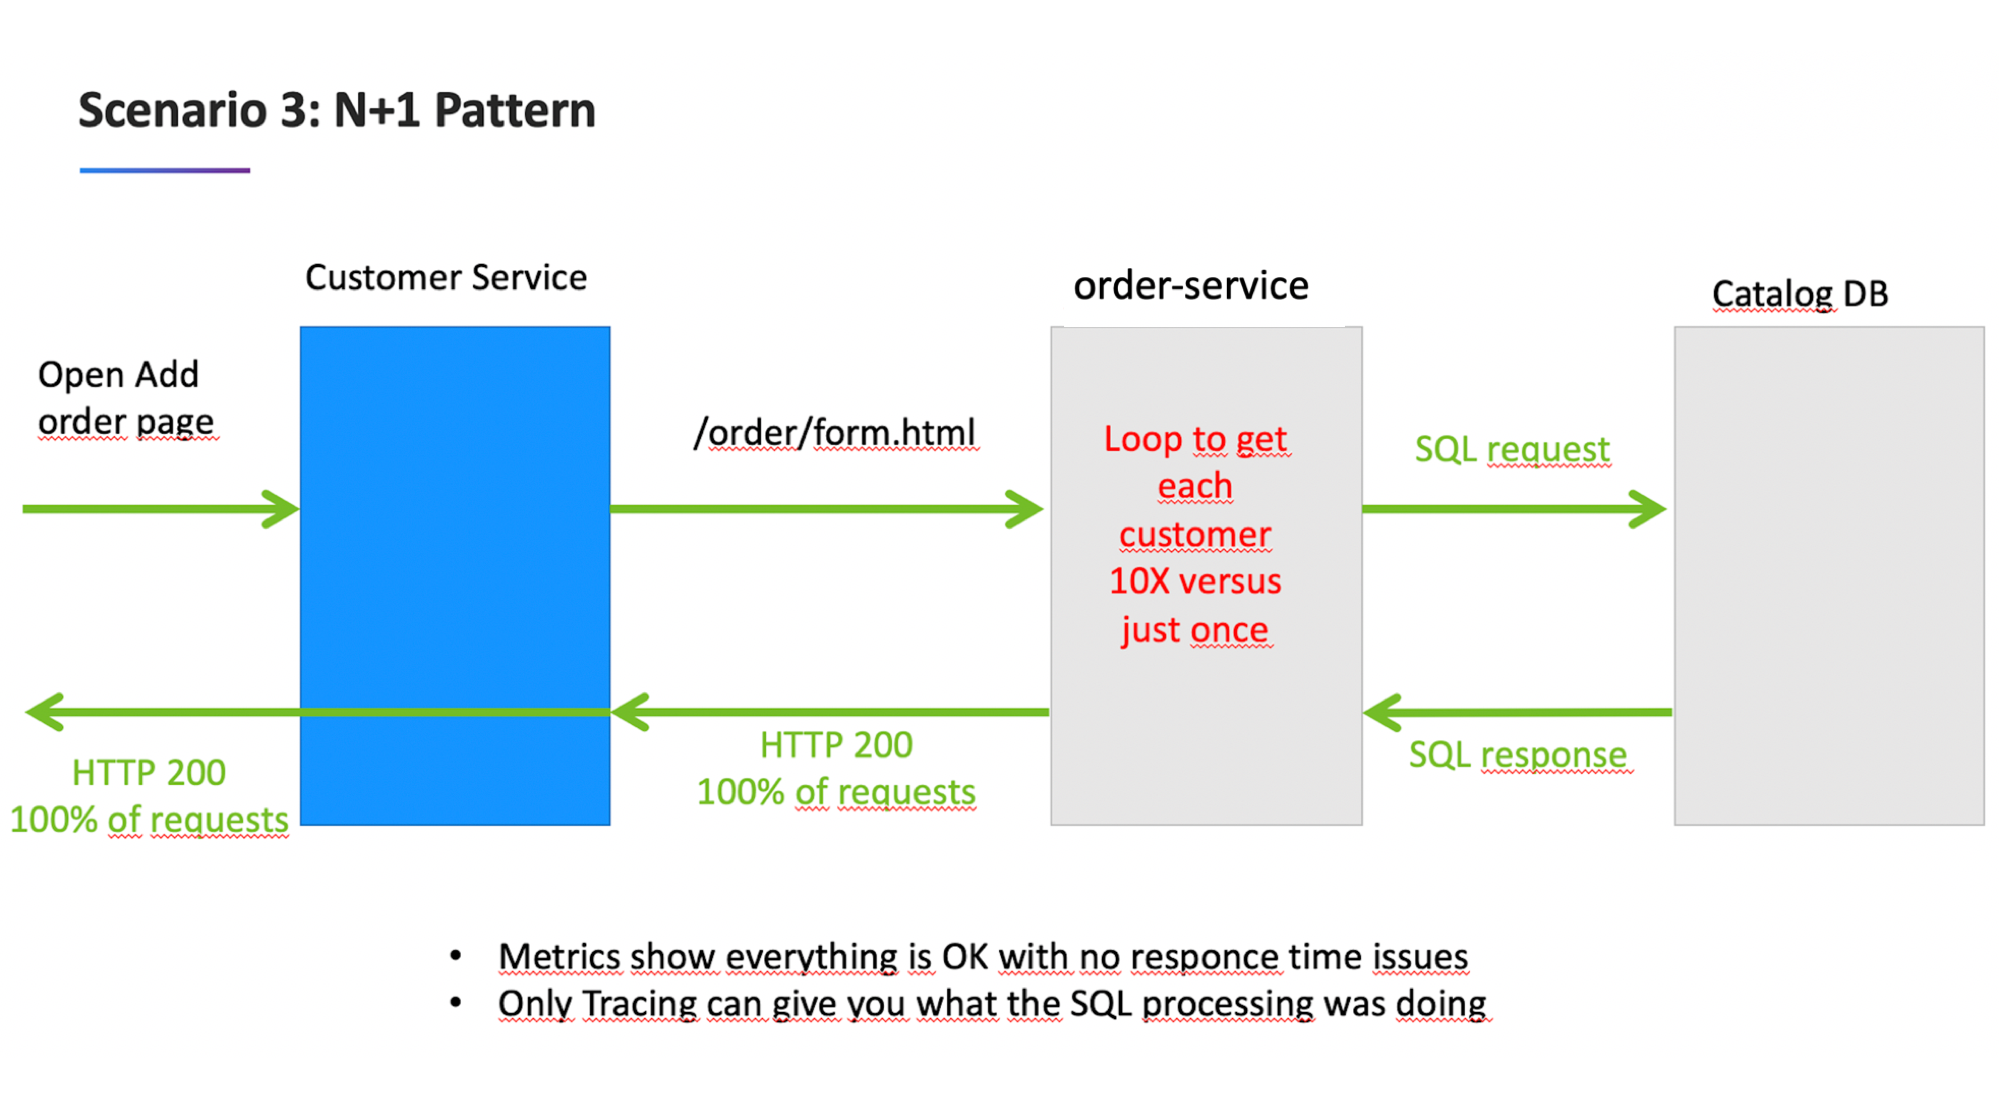
| order-service | 2.0.0 | 50% exception for /order/line URL and n+1 back-end calls for /order/form.html |
| customer-service | 3.0.0 | Normal behavior |
| order-service | 3.0.0 | Normal behavior |
Problem Scenarios details
Deploy dtdemos/customer-service:2.0.0
Deploy dtdemos/order-service:2.0.0
Both these scenearios are enabled
and…
Examine Dynatrace
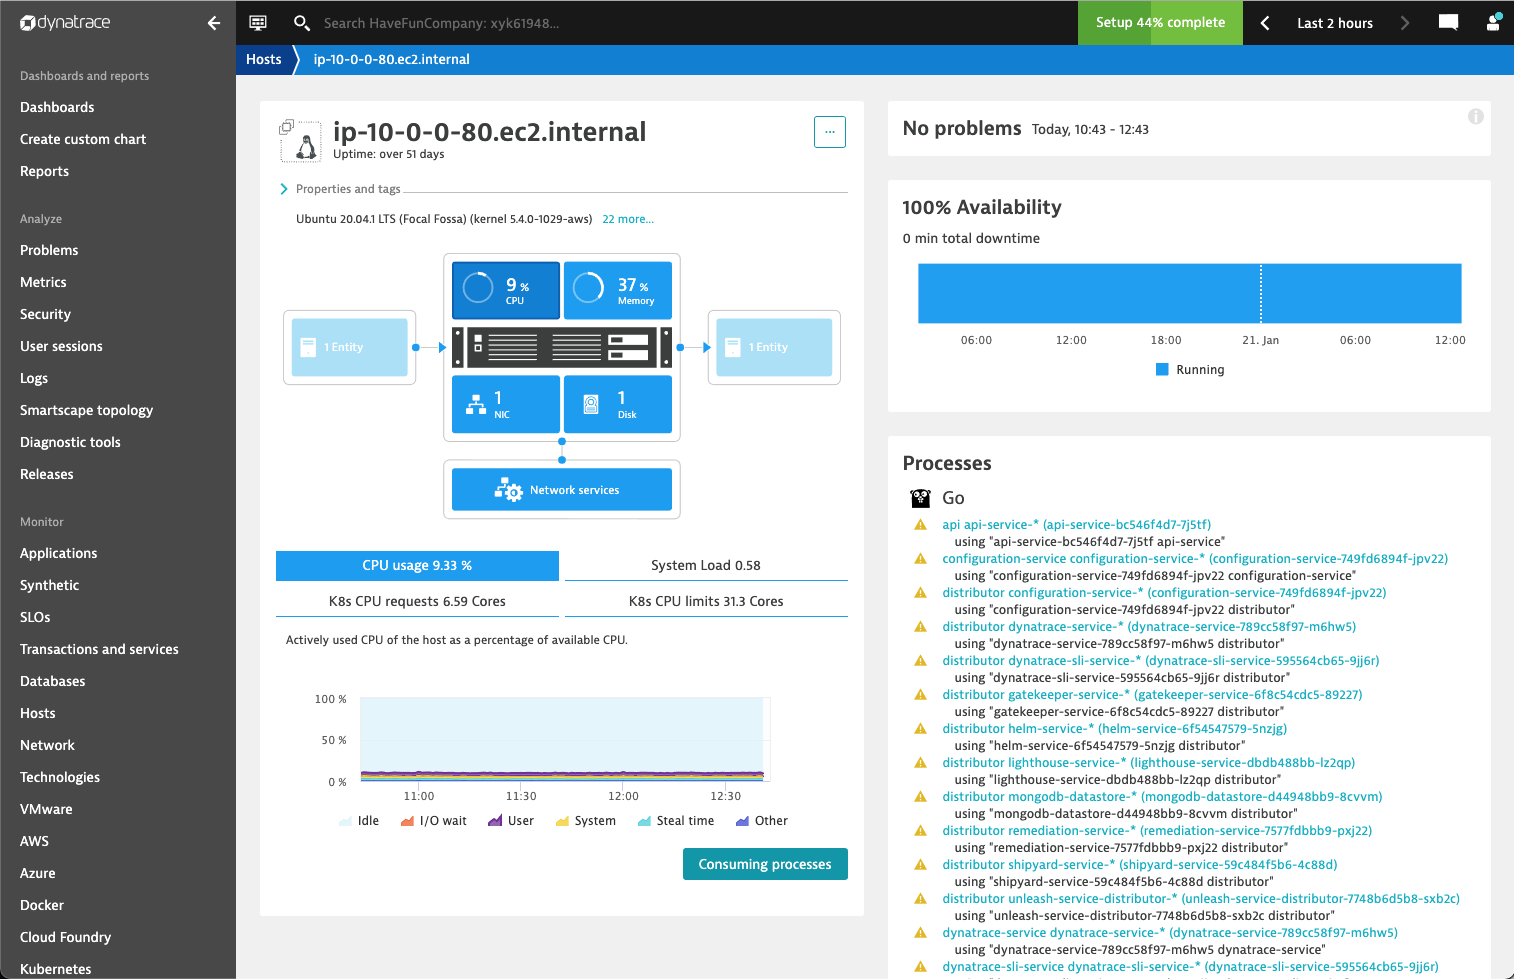
Now lets take a look at what we have discovered in Dynatrace.
Open Dynatrace and navigate to Hosts in the menu and select the host.
Let’s examine all the proceses automatically discovered by the Dynatrace oneAgent.
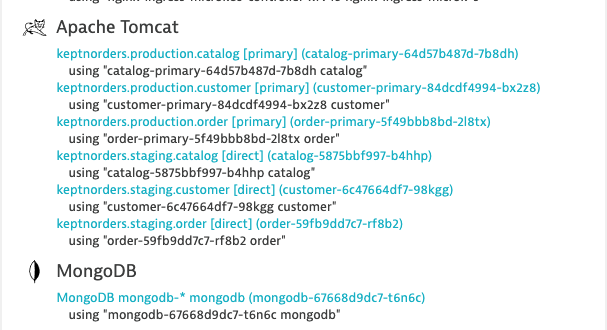
We can also see the processes for the order application.
Next we can examine the Transactions and Services.
Select Transactions and Services from the menu.
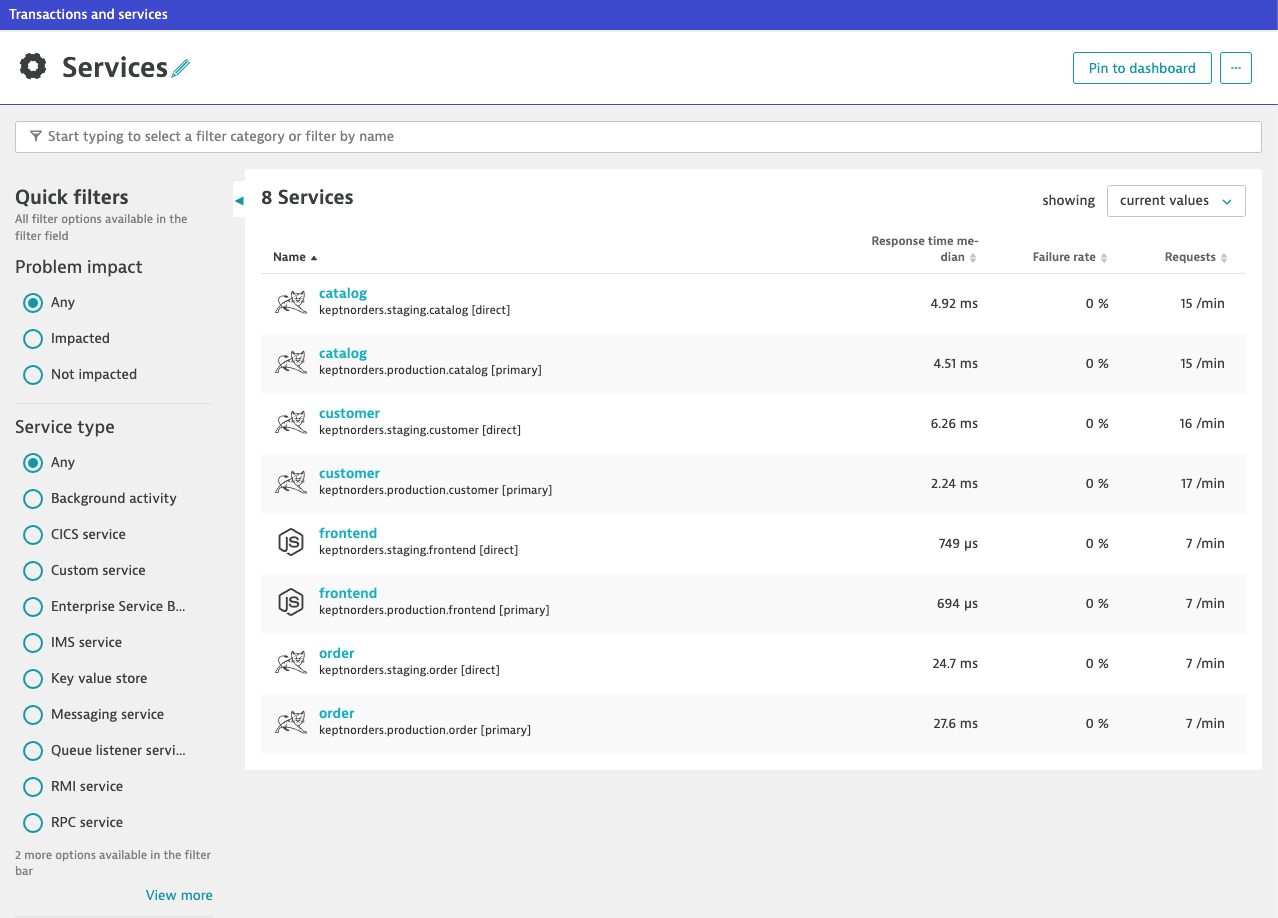
You can also change the focus by using the management zone filter.
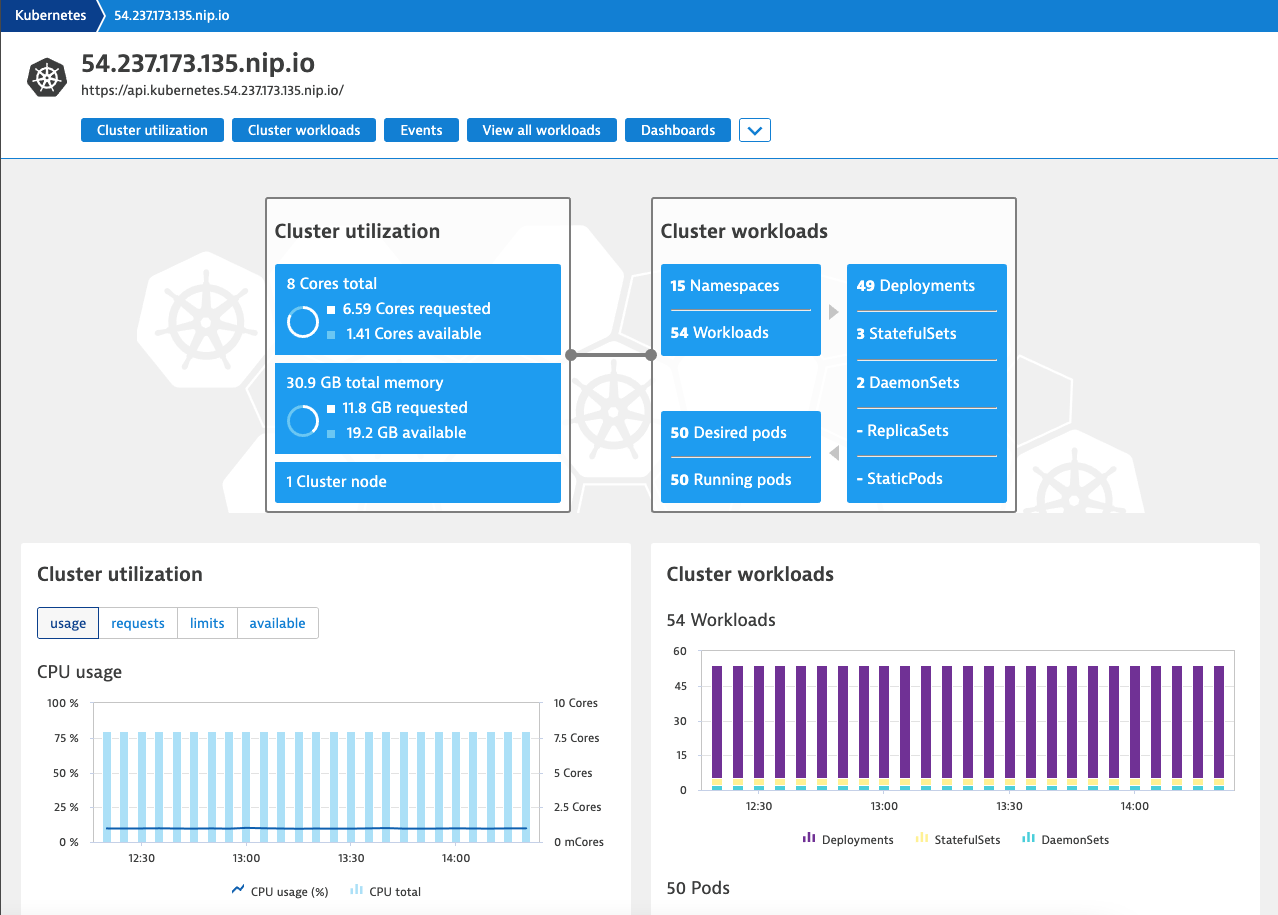
Finally, we can also see how the KIAB configured Kubernetes cluster monitoring.
Select Kubernetes from the menu.
Pre-configured items also include:
- Dashboards
- Request Attributes
- Calculated Service Metrics
- Management Zones
- Automatically Applied Tags
- Applications
- Problem notification
- Process and service naming rules
Due to to time constrainsts, we will visit each area as needed during the lab exercises.
Final validation of envionrment
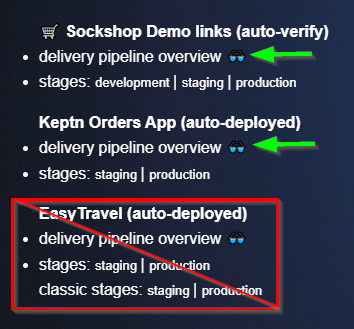
Validate each project stage has been properly deployed by navigating to the KIAB homepage then selecting each application overview link (except EasyTravel which will not be part of this lab).