Load Test Analysis Performance Issue
Learn how to use Dynatrace features that support Performance testing for each phase: scripting, analysis, and reporting
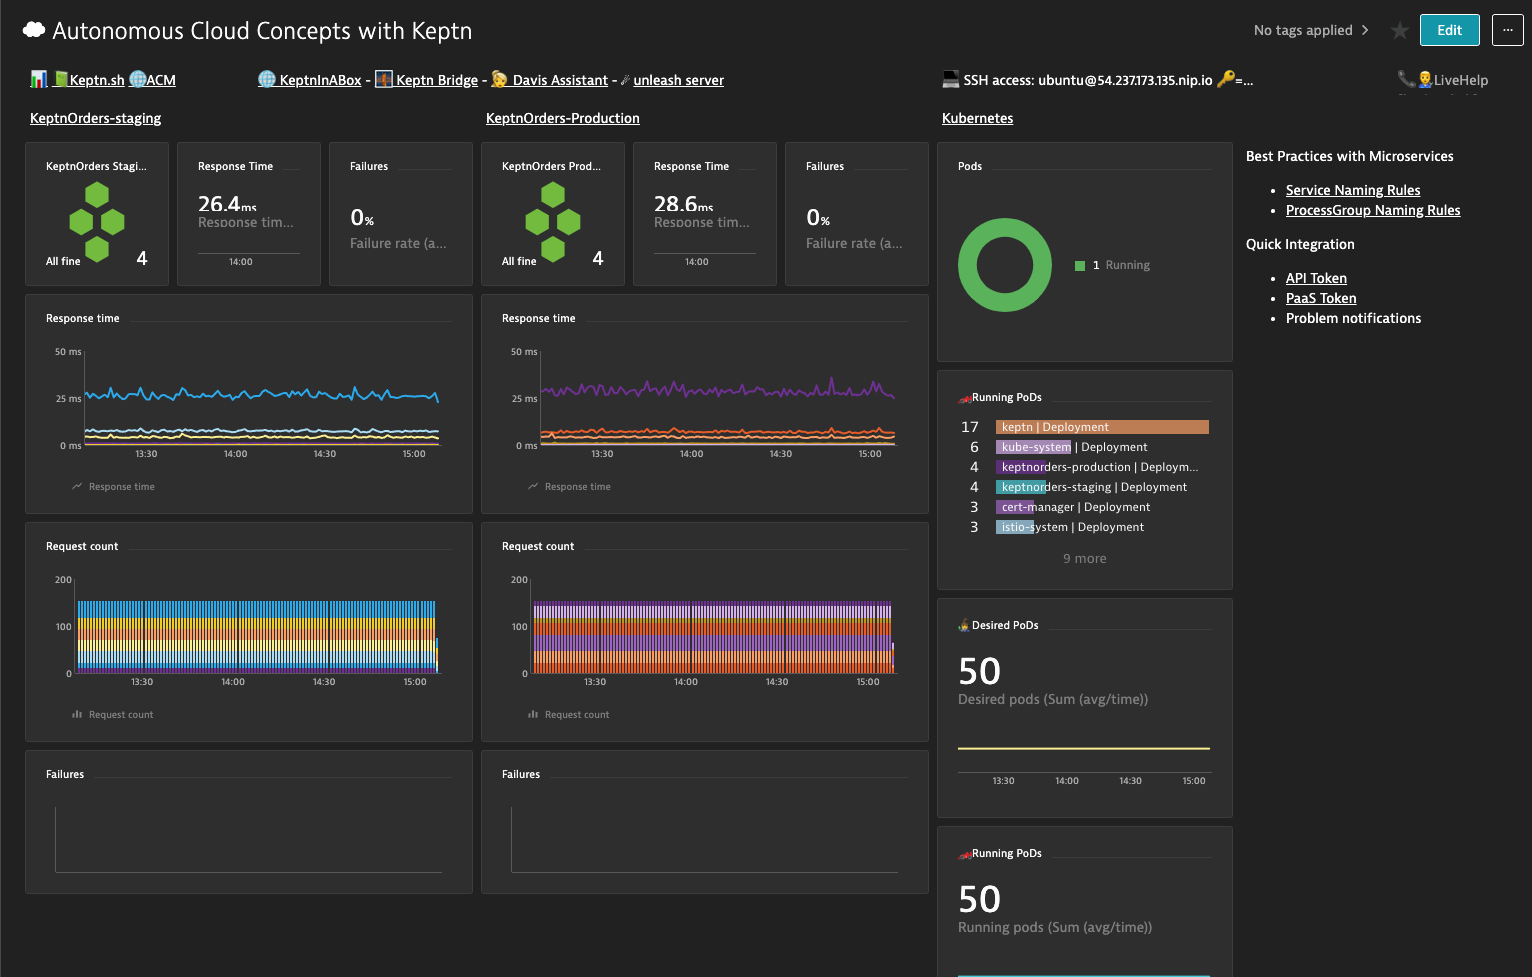
Now that we have our Lab setup let’s start by viewing a dashboard.
Click “Dashboards” from the Main Navigation menu.
Then Select the “Autonomous Cloud Concepts with Keptn” Dashboard.

Now you should see your Dashboard.
Next we will need to create a few configuration items and kick off a load test.
Configuration
- Create a service tag
- Process Detection Naming rule
- Architecture Validation
- Run first Load Test
- Describe Dynatrace Load Test Request Attribute
- Describe Calculated Service Metrics for Load Test Steps
- Kick off Keptn Customer 2 Build
- Update Keptn: keptnorders staging Management Zone
- Run Load Test
- Examine Performance Test Dashboard with Transaction Steps
- Load Test Performance Analysis
Create Service tag
To support tagging, Dynatrace provides both a manual approach (Settings > Tags > Manually applied tags) and an automated, rule-based approach (Settings > Tags > Automatically applied tags).
We are going to apply a manual tag for this exercise.
First we need to create a tag on the service. Navigate to Transactions and services>frontend
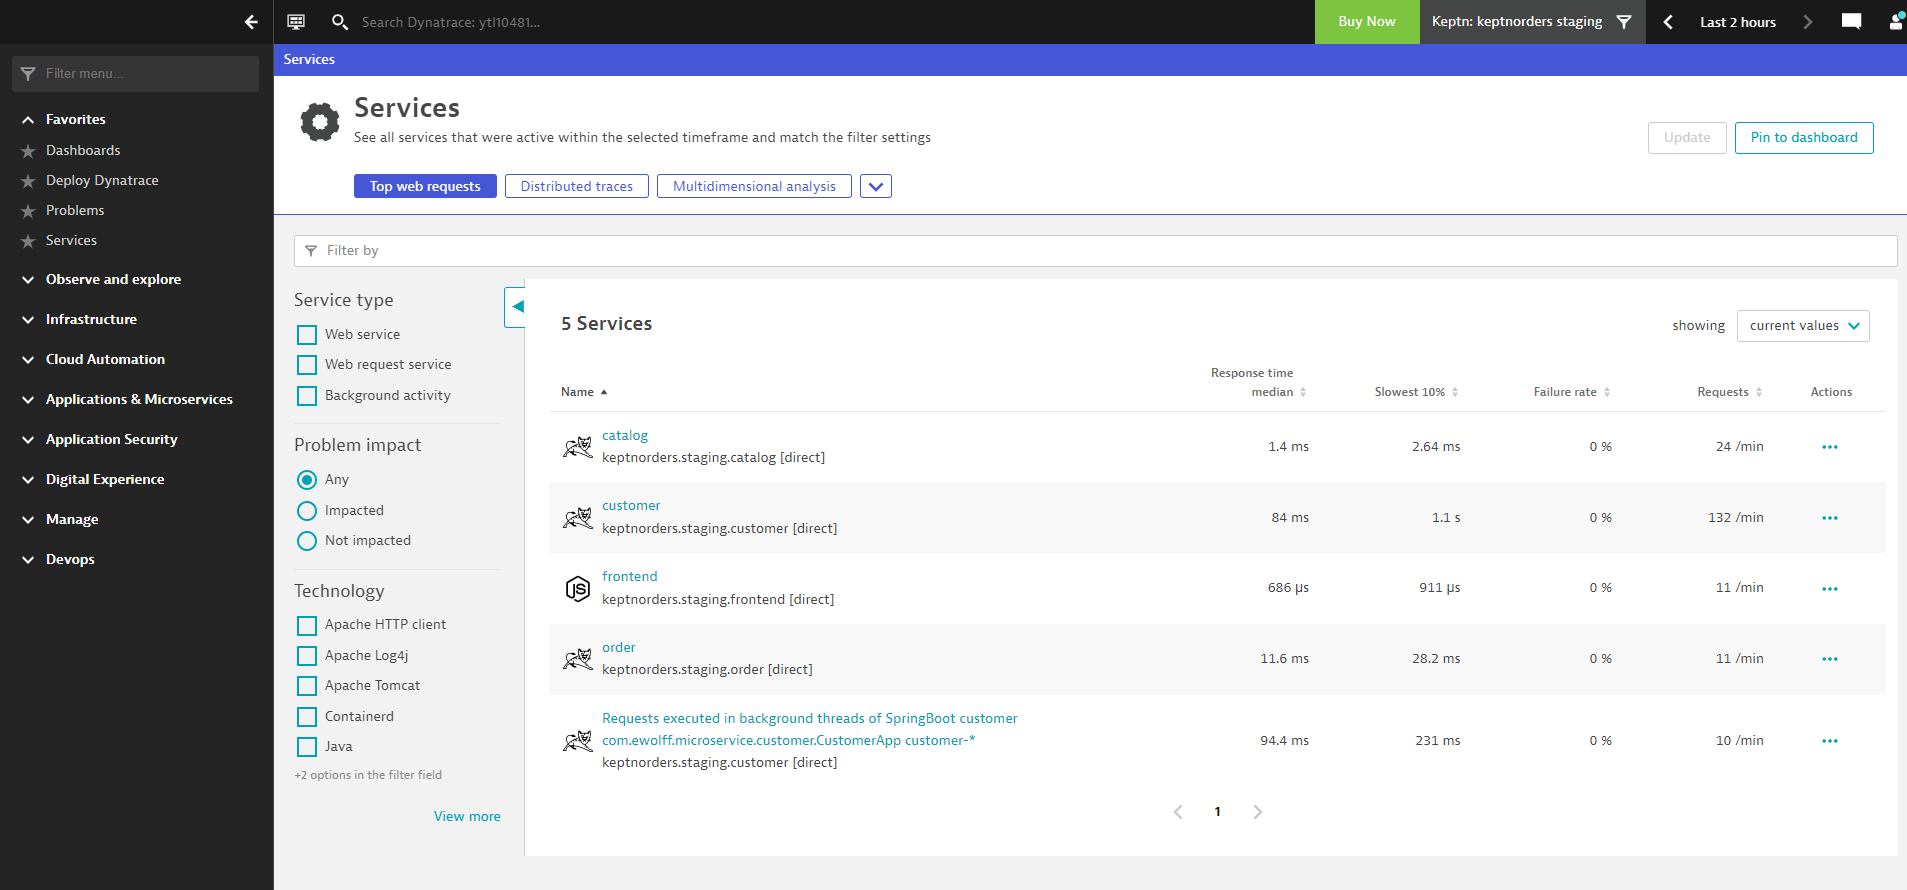
We are looking for frontend with keptnorders.staging.frontend [direct]
Now we can create the “evalservice” tag.
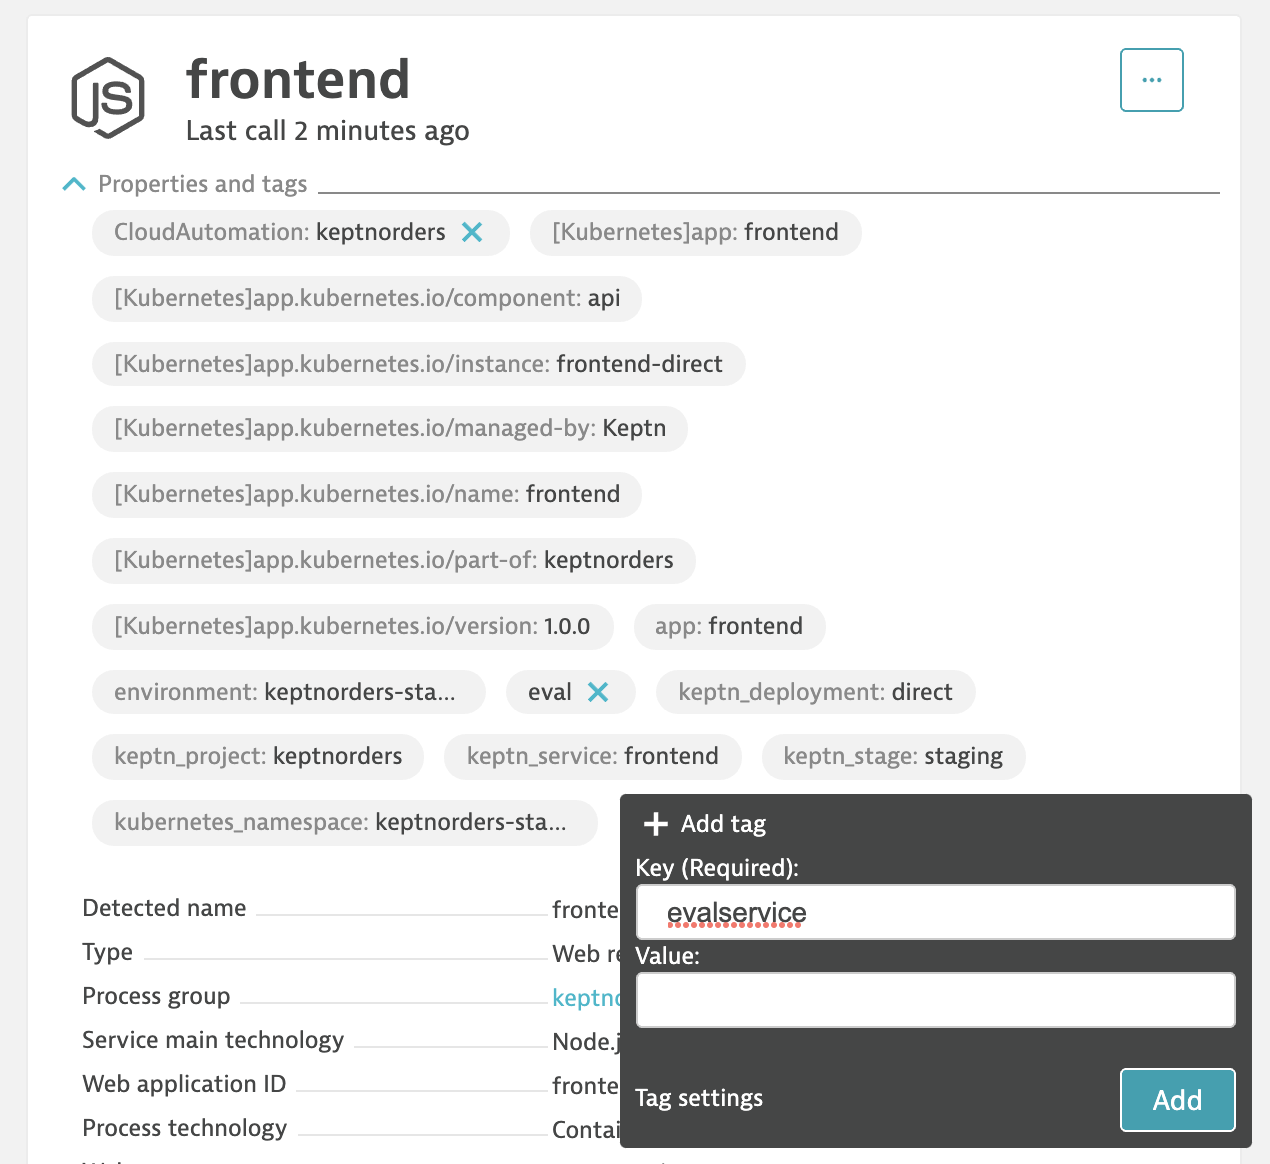
Let’s also create a tag “eval” tag on the same service
Next, we need to also tag the production frontend service. Navigate back to the Services screen and select the Keptn: keptnorders production managment zone.
Navigate into the frontend [primary] service and tag with “peval”
Kick off our first load test
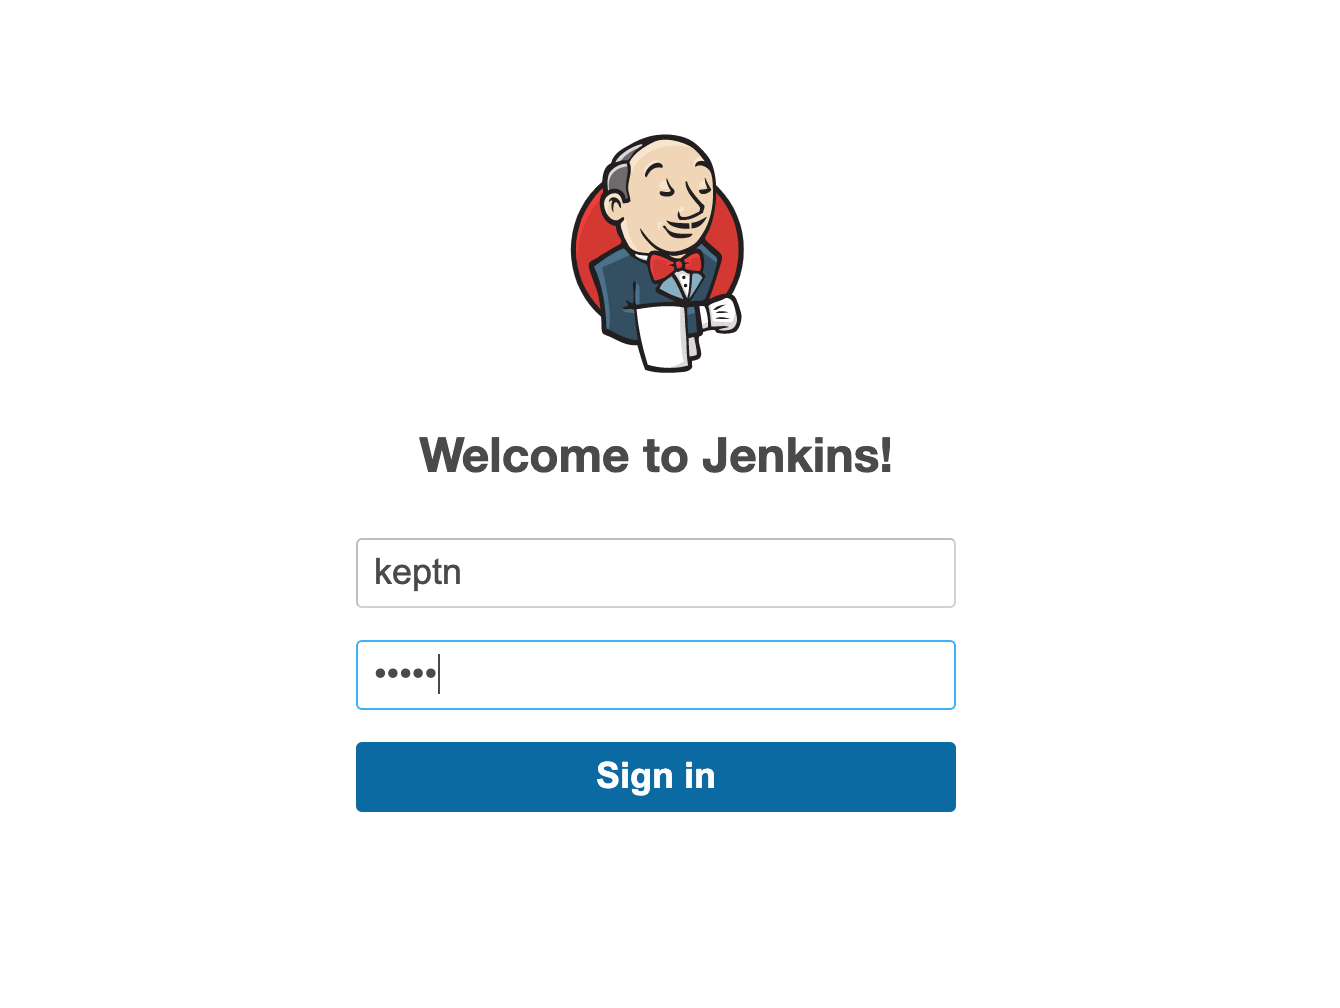
Login to Jenkins
- username = keptn
- password = keptn
We are going to run the 03-simpletest-qualitygate pipeline.
Click build this initial build will fail.
Refresh the page, now we can do a Build with Parameters
verify the Deployment URL, this should match the IP address for your lab environment.
You will also notice, this is where we are using the tag “eval” for the testing.
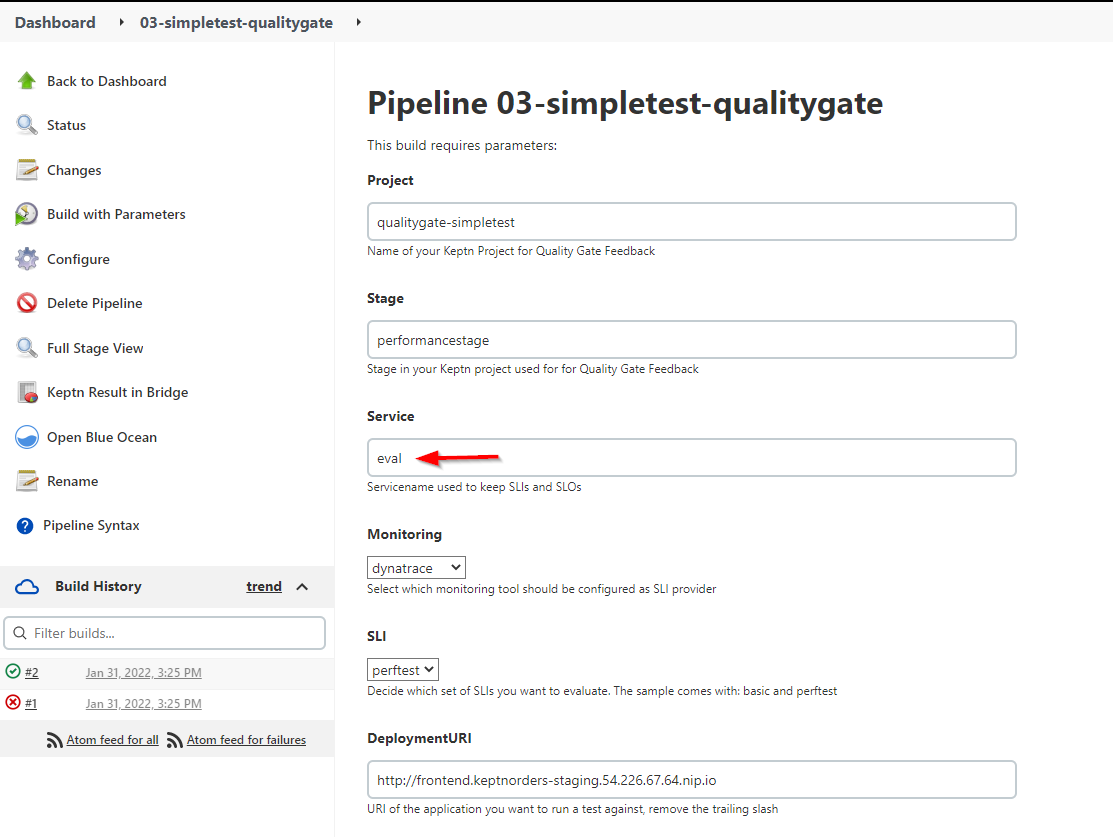
Click Build
Create Process Group Naming Rule (if not created)
Hopefully the naming rule has been created by the API call. We need to validate that this has occurred.
If the rule is present, then we can skip to Architecture Validation - Service Flow
If the Rule has not been created, then we will need to follow these steps.
Go to Settings > Processes and Containers > Process group naming
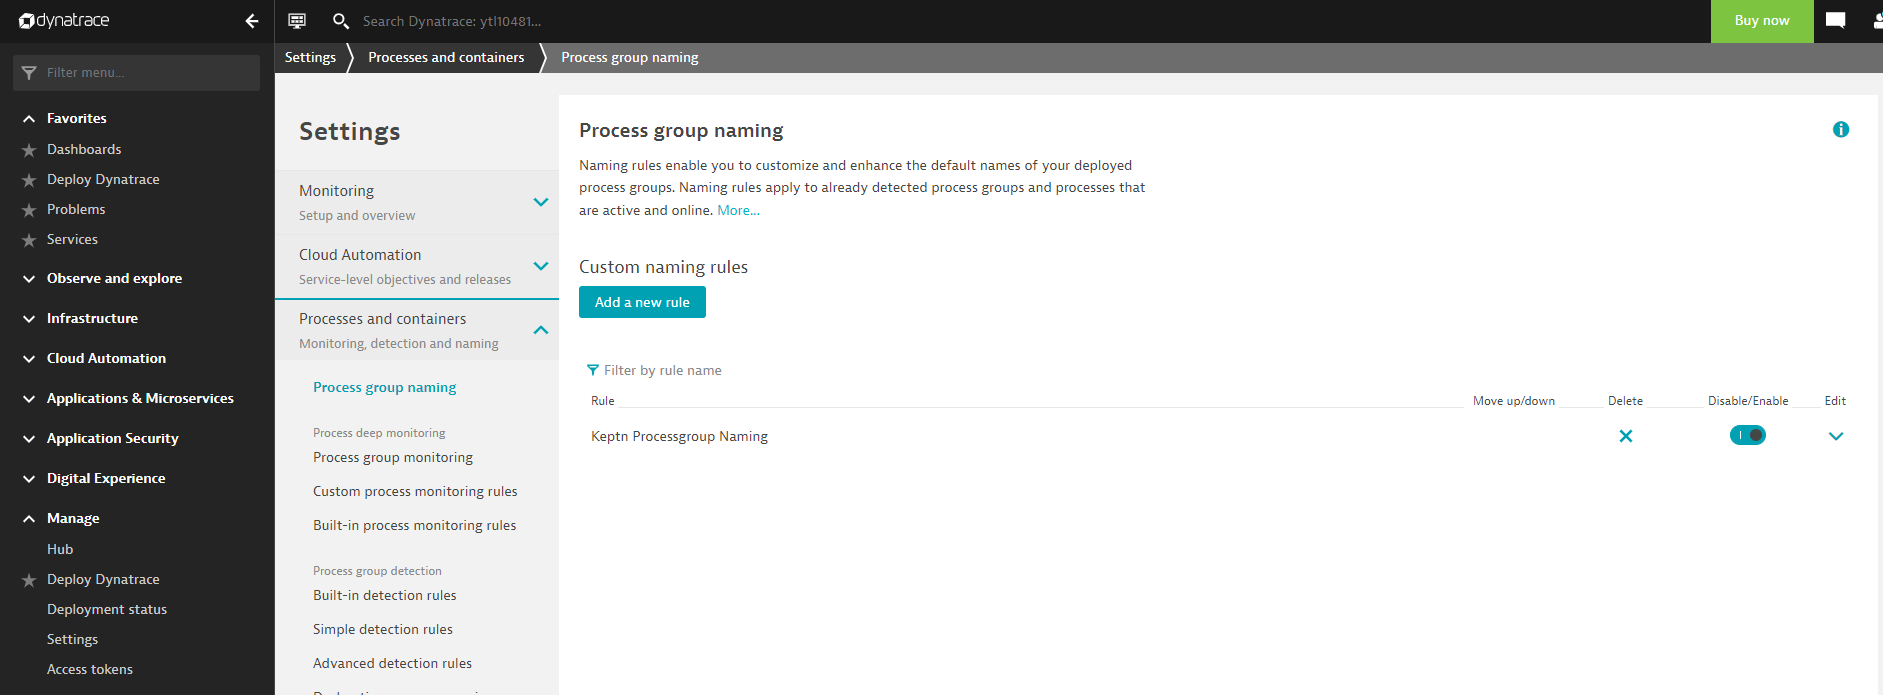
Then select Add new rule
Now we will create the rule with the following parameters.
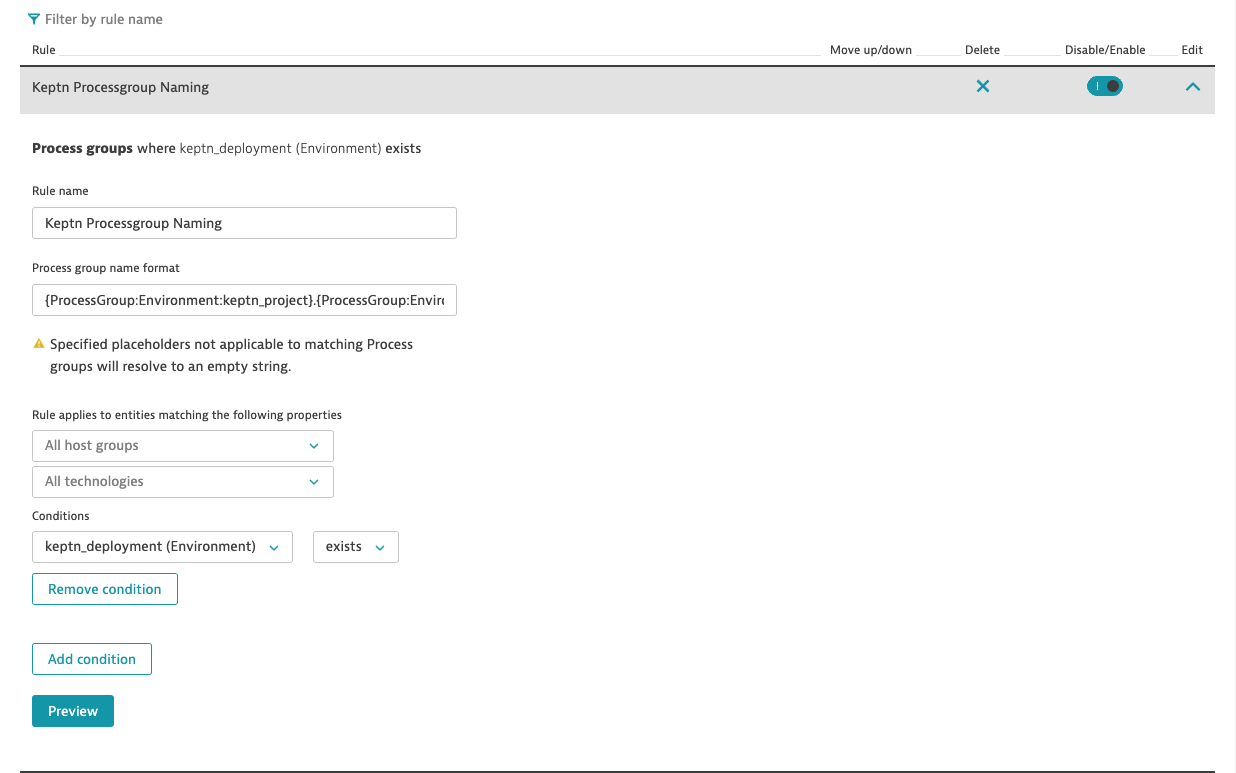
You can cut and paste these items where applicable.
| Field | Value |
|---|---|
| Rule Name | Keptn Processgroup Naming |
| Process group naming format | {ProcessGroup:Environment:keptn_project}.{ProcessGroup:Environment:keptn_stage}.{ProcessGroup:Environment:keptn_service} [{ProcessGroup:Environment:keptn_deployment}] |
| Conditions | keptn_deployment (Environment) exists |
Click Preview -> create rule -> save changes
Architecture Validation - Service Flow
As testers, we typically only test against the service endpoint. As performance engineers we should however understand what happens end-to-end with each request. What other services does it call? How many round trips to the database does it make? Does service load balancing and failover work correctly? Do the caching layers work well? And do we have any bad architectural patterns such as a data-driven N+1 query problem?
In Dynatrace, we can analyze the Service Flow which shows us the full end-to-end flow of every request executed against our service endpoint. You can also apply filters to only focus on a particular test transaction, a specific time frame or compare the flow of failing vs non- failing transactions.
Click “Frontend” from the Main Navigation menu. Then click frontend.keptnorders-staging.
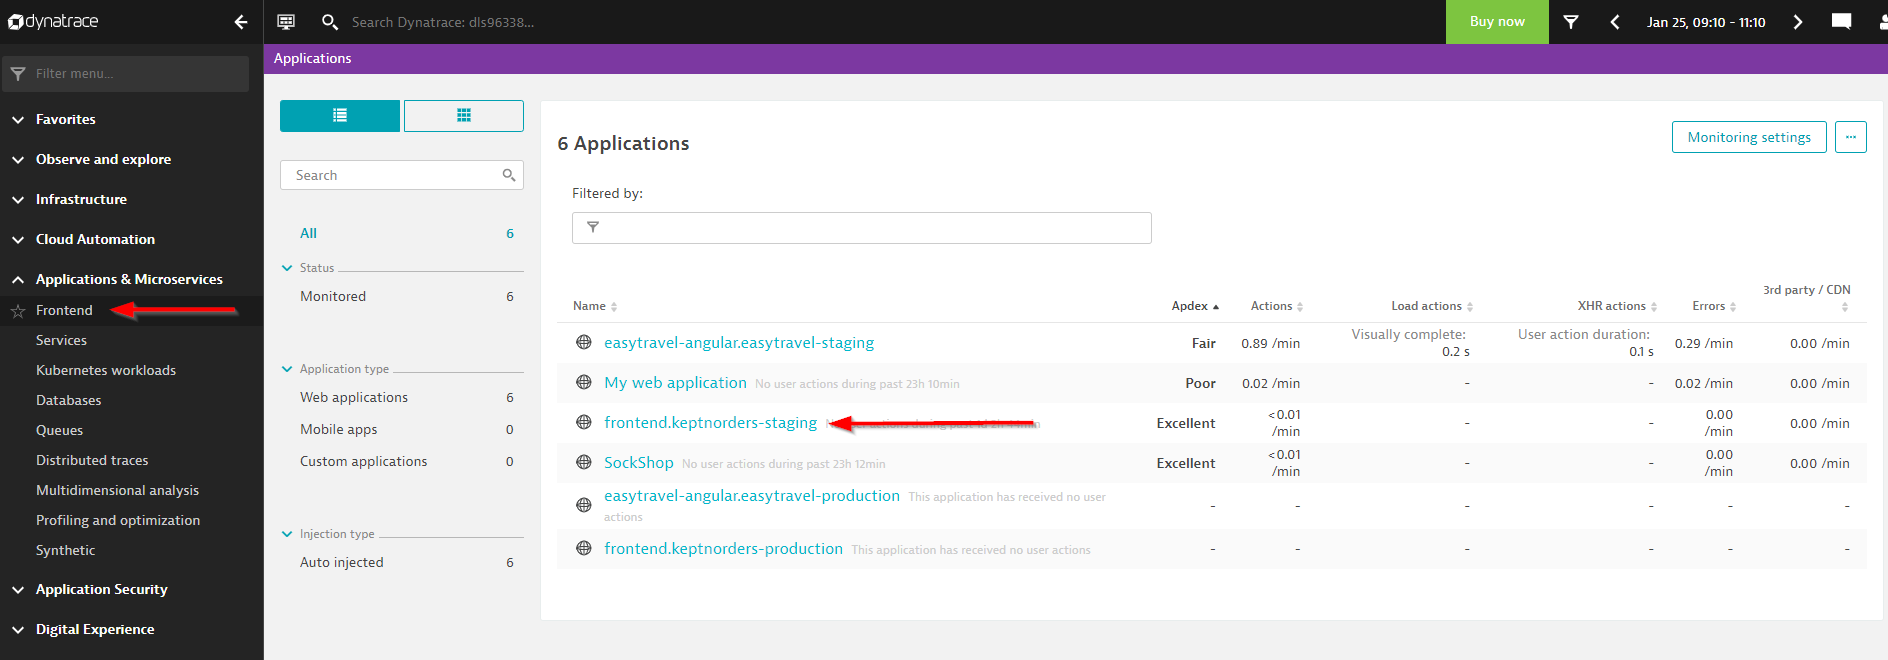
This will bring up the easytravel-angular.easytravel-staging Performance Overview. In the Dynatrace infographic click on the 1 Service box. Then under the Called services table click on the aqua box called View service flow.
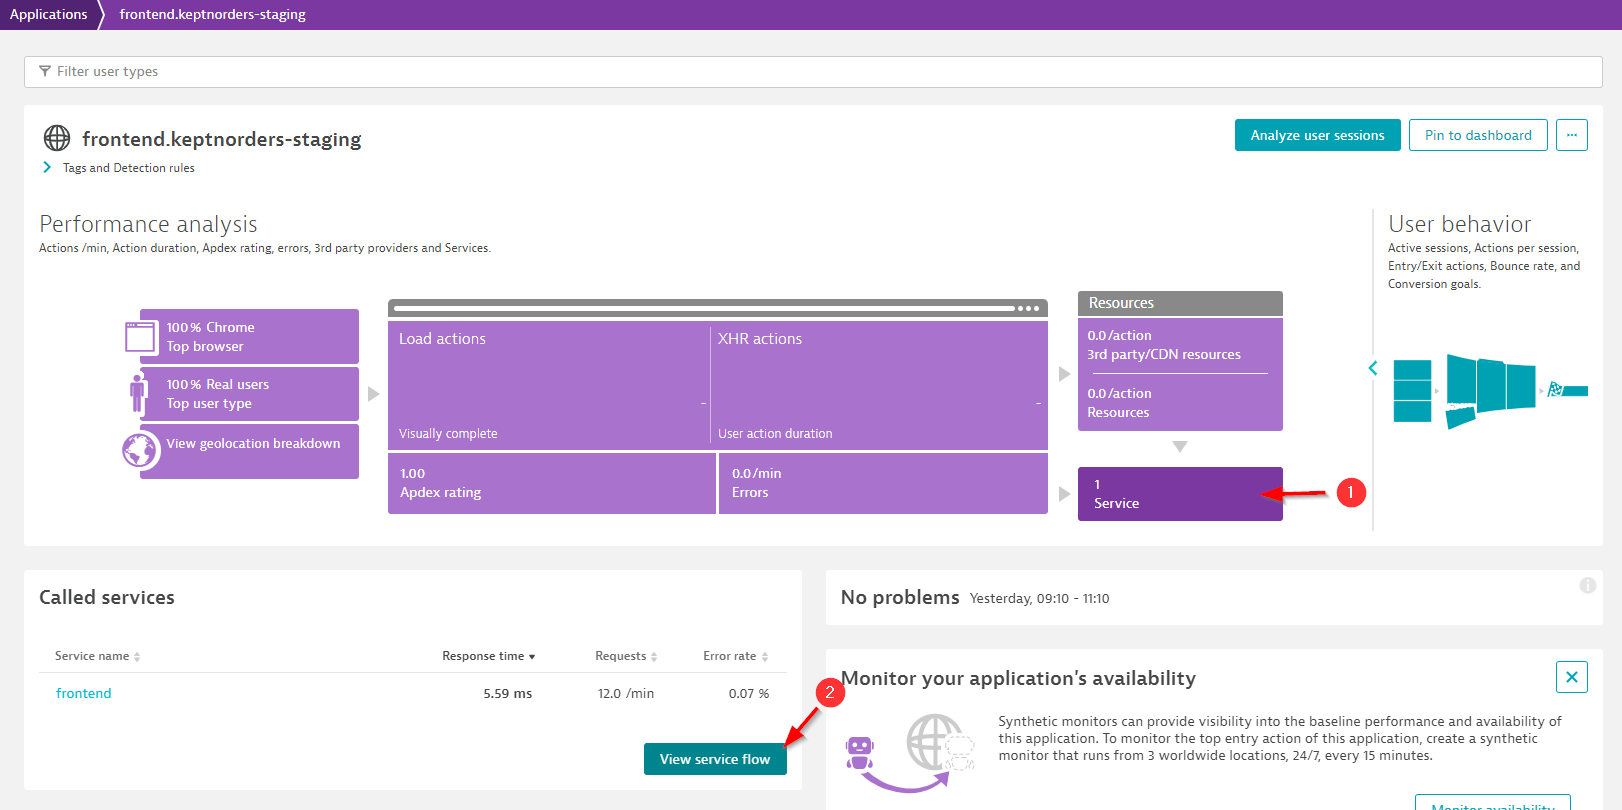
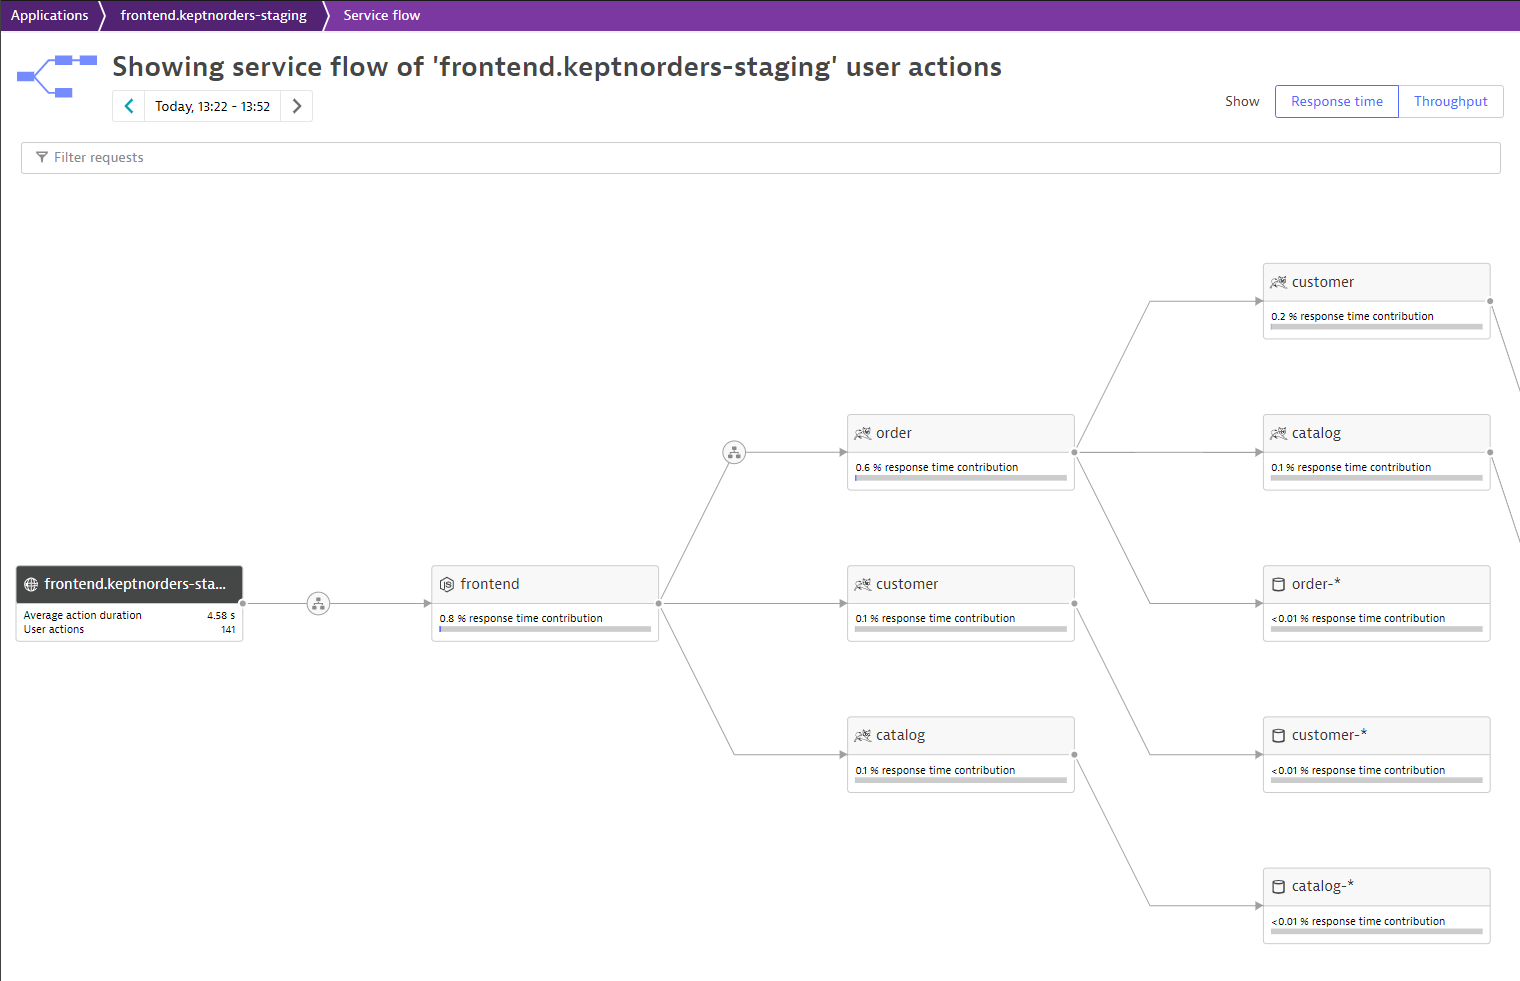
This will bring up the Service flow for the frontend.keptnorders-staging. View results.
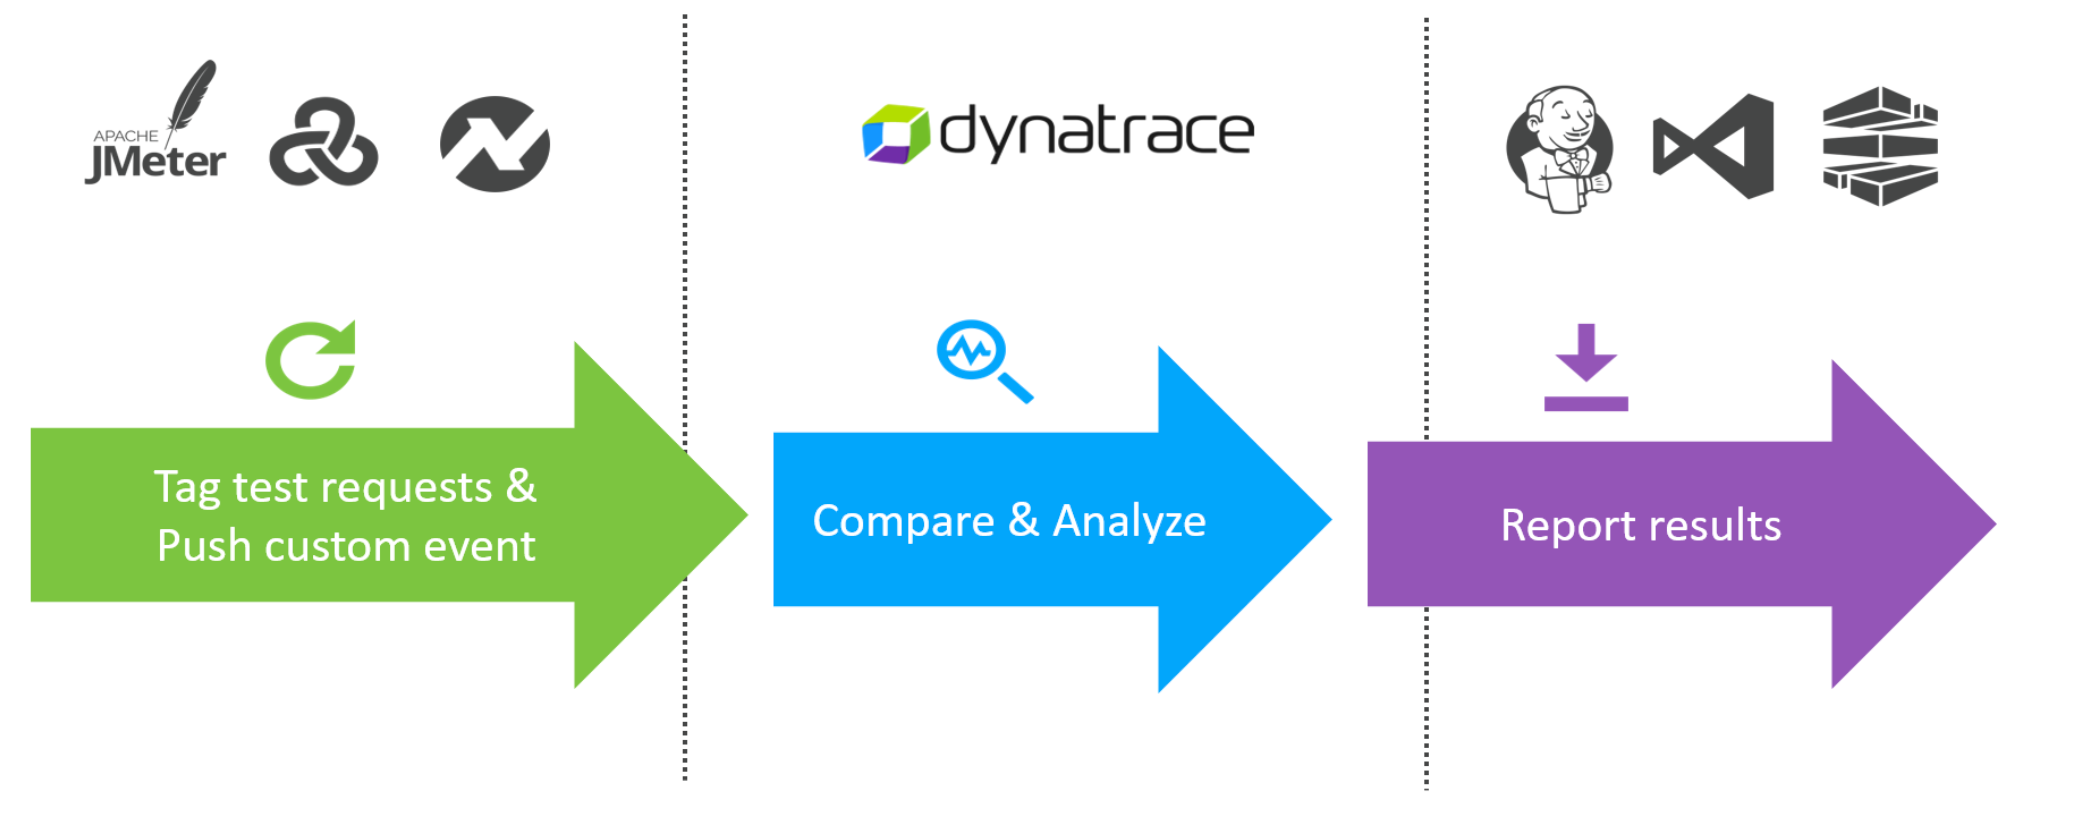
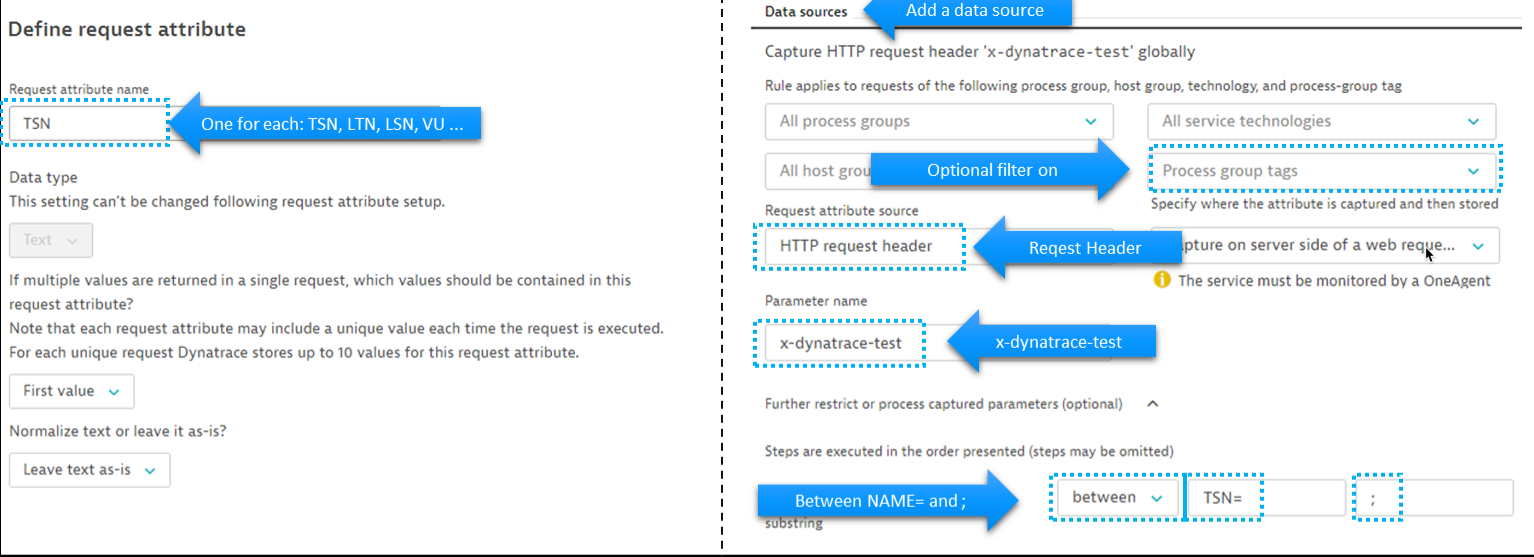
Describe Dynatrace Load Test Request Attribute
Dynatrace by default captures and traces every single incoming request on our instrumented applications and services. This allows us to analyze metrics (SLIs) for each individual endpoint URL. While this is great, the URL is not necessarily meaningful when we want to analyze details for a step from your load testing script, e.g: Login, Add to Cart, Checkout.
While executing a load test from your load testing tool of choice (JMeter, Neotys, LoadRunner, etc.) each simulated HTTP request can be tagged with additional HTTP headers that contain test-transaction information (for example, script name, test step name, and virtual user ID).
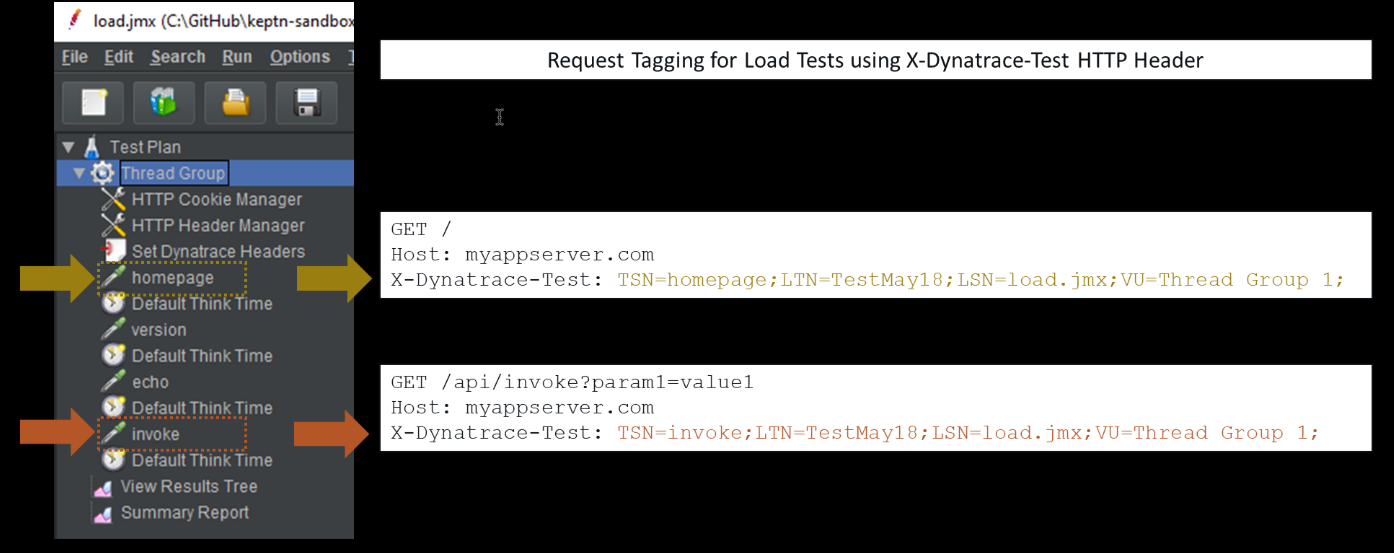
The header x-dynatrace-test is used one or more key/value pairs for the header. Here are some examples:
| Key | Description |
|---|---|
| VU | Virtual User ID of the unique user who sent the request. |
| SI | Source ID identifies the product that triggered the request (JMeter, LoadRunner, Neotys, or other) |
| TSN | Test Step Name is a logical test step within your load testing script (for example, Login or Add to cart. |
| LSN | Load Script Name - name of the load testing script. This groups a set of test steps that make up a multi-step transaction (for example, an online purchase). |
| LTN | The Load Test Name uniquely identifies a test execution (for example, 6h Load Test – June 25) |
| PC | Page Context provides information about the document that is loaded in the currently processed page. |
Dynatrace can analyze incoming HTTP headers and extract such contextual information from the header values and tag the captured requests with request attributes. Request attributes enable you to filter your monitoring data based on defined tags.
You can use any (or multiple) HTTP headers or HTTP parameters to pass context information. The extraction rules can be configured via Settings –> Server-side service monitoring –> Request attributes.
We have setup the Load Test Request attributes for you. Below is an example setup but we will also show you in your environment where they are.
Documentation: Tag tests with HTTP headers
Describe Calculated Service Metrics for Load Test Steps
Dynatrace automatically captures important metrics for services with no configuration required. Additionally you might need additional business or technical metrics that are specific to your application. These metrics can be calculated and derived based on a wide variety of available data within the captured PurePath. This allows you to further customize key performance metrics for which alerts should be generated and helps you keeping an eye on them by pinning them to your dashboards.
For Performance Testing you can use Calculated service metrics to track your Performance transaction steps as an example. Once created, these metrics can be used in Dashboards and alerting during the Performance Test but also can be used in analysis after the Performance test is complete.
![]()
Blog: Tutorial: Guide to automated SRE-driven performance engineering
Documentation: Calculated metrics for services
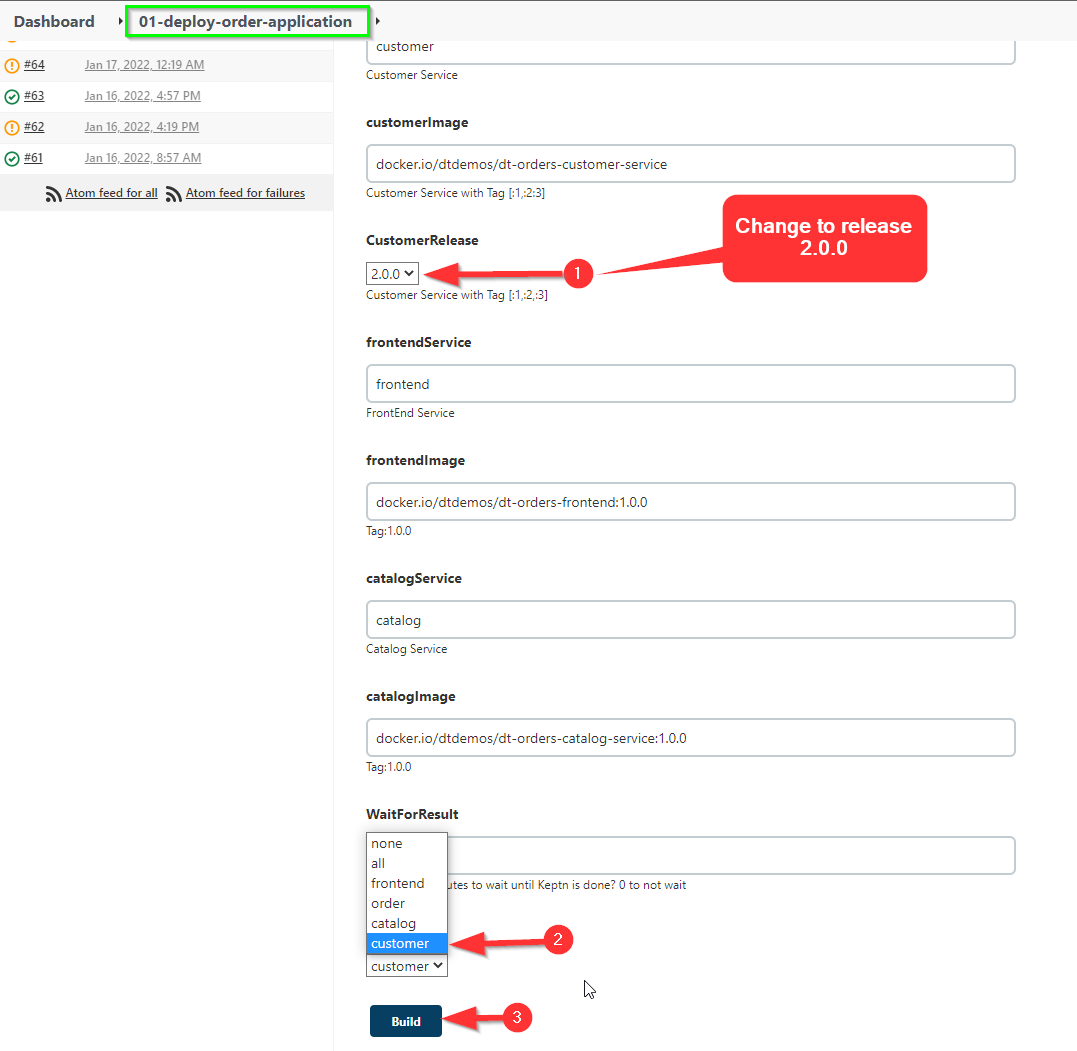
Kick off Keptn Customer Build
Click on 01_deploy_order_application pipeline
Now we are going to push the customer version 2.0.0.
Select Build with parameters
- In the customerimage Release field we need to select 2.0.0
- In the DEPLOY_TO field, change the dropdown box to customer
Next, click the “Build” button.
Update Keptn: keptnorders staging Management Zone
Each customizable management zone comprises a set of monitored entities in your environment, be it hosts that share a common purpose, a specific application, a staging environment, or services of a certain technology. Management zones may overlap, just as team responsibilities often overlap. Users may be granted access to entire environments, a specific management zone, or a subset of related management zones.
This exercise shows how to update a management zone that will be used in dashboards to show process and host metrics for analysis.
In Dynatrace on the navigation menu, navigate to settings –> preferences –> management zones
Click Keptn: keptnorders staging management zone and add a new rule with configuration as show below.
| Field | Value |
|---|---|
| Rule applies to | Process groups |
| Condition | Process Group Name begins with keptnorders.staging |
| Apply to underlying hosts | [x] |
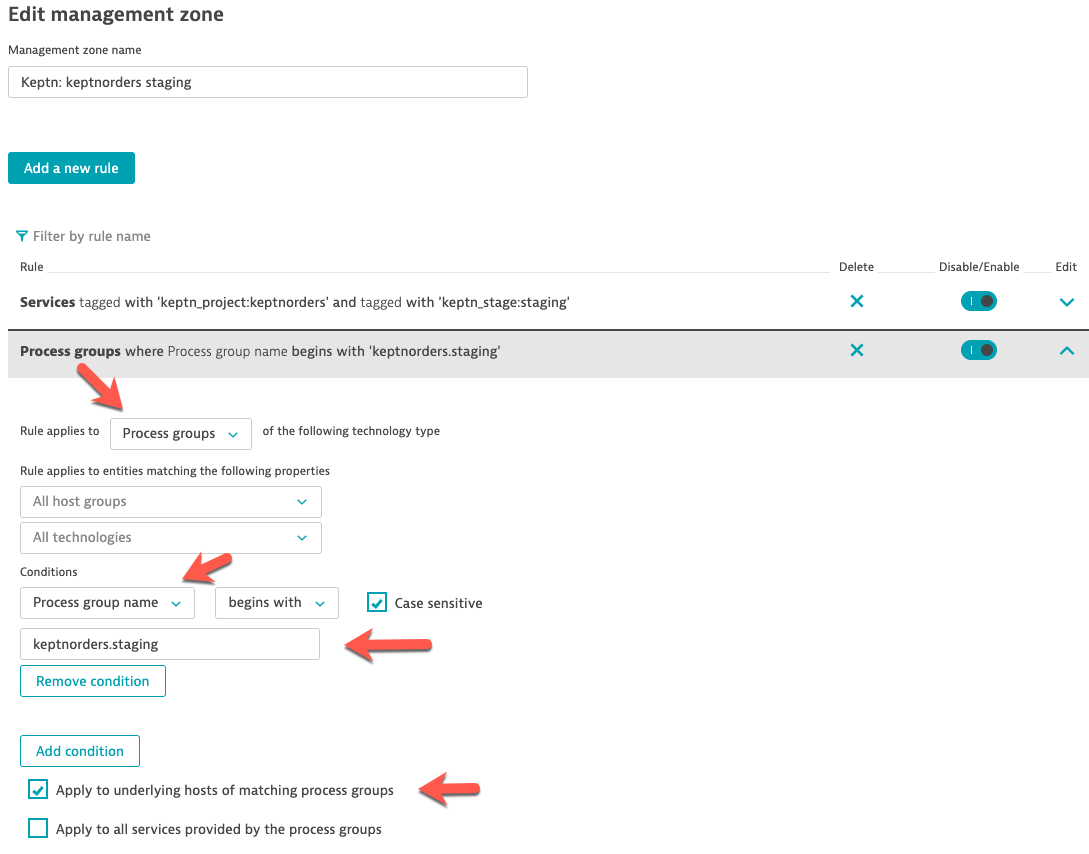
Click the preview button to verify; save the zone.
Kick off a load test
We are going to run the 03-simpletest-qualitygate pipeline again.
Click Build
Examine Performance Test Dashboard with Transaction Steps
We have provided a Performance Test Dashboard with Transaction Steps in your environment. This dashboard provides a complete overview for your Performance Test focusing on SLIs (Latency, Traffic, Errors & Saturation). Included in this dashboard is the following: Health Status, Transaction Steps Scorecard, Services Overview, Database Overview, Process Overview and Hosts Overview. This dashboard also provides quick analysis links.
Click Dashboards from the Main Navigation menu.
Then Select the Performance Test Dashboard with Transaction Steps Dashboard.
![]()
Load Test Performance Analysis
Dynatrace uses a sophisticated AI causation engine, called Davis®, to automatically detect performance anomalies in your applications, services, and infrastructure. Dynatrace-detected problems are used to report and alert on abnormal situations, such as performance degradations, improper functionality, or lack of availability (i.e., problems represent anomalies in baseline system performance).
For Performance Testing the Dynatrace AI might not generate a Problems unless you are doing continuous performance testing. You can setup custom alerts with static thresholds.
If a Dynatrace Problem has generated a Problem during your Performance Test that is always a best place to start.
You can also analyze the data using custom Dashboards as well as out of the box workflows. Your approach should be based on the type of performance analysis you want to do (for example, crashes, resource and performance hotspots, or scalability issues).
Following is an overview of using our Performance Test Dashboard with Transaction Steps.
Open the “Performance Test Dashboard with Transaction Steps” dashboard.
Then click on the Transactions link under Transaction links section on the left side of the dashboard.
![]()
This will bring us to Multidimensional analysis that is showing response time split by the TSN request attribute. Note, you can also create your own Multidimensional analysis views and save them by going to the Diagnostic tools–>Top web requests configure desired settings.
For Developers to understand how to avoid future performance issues and proactively optimize performance, you must be able to analyze real-time data and understand code performance bottlenecks.
We are going to focus on the TSN=customer step name transaction running on the customer service.
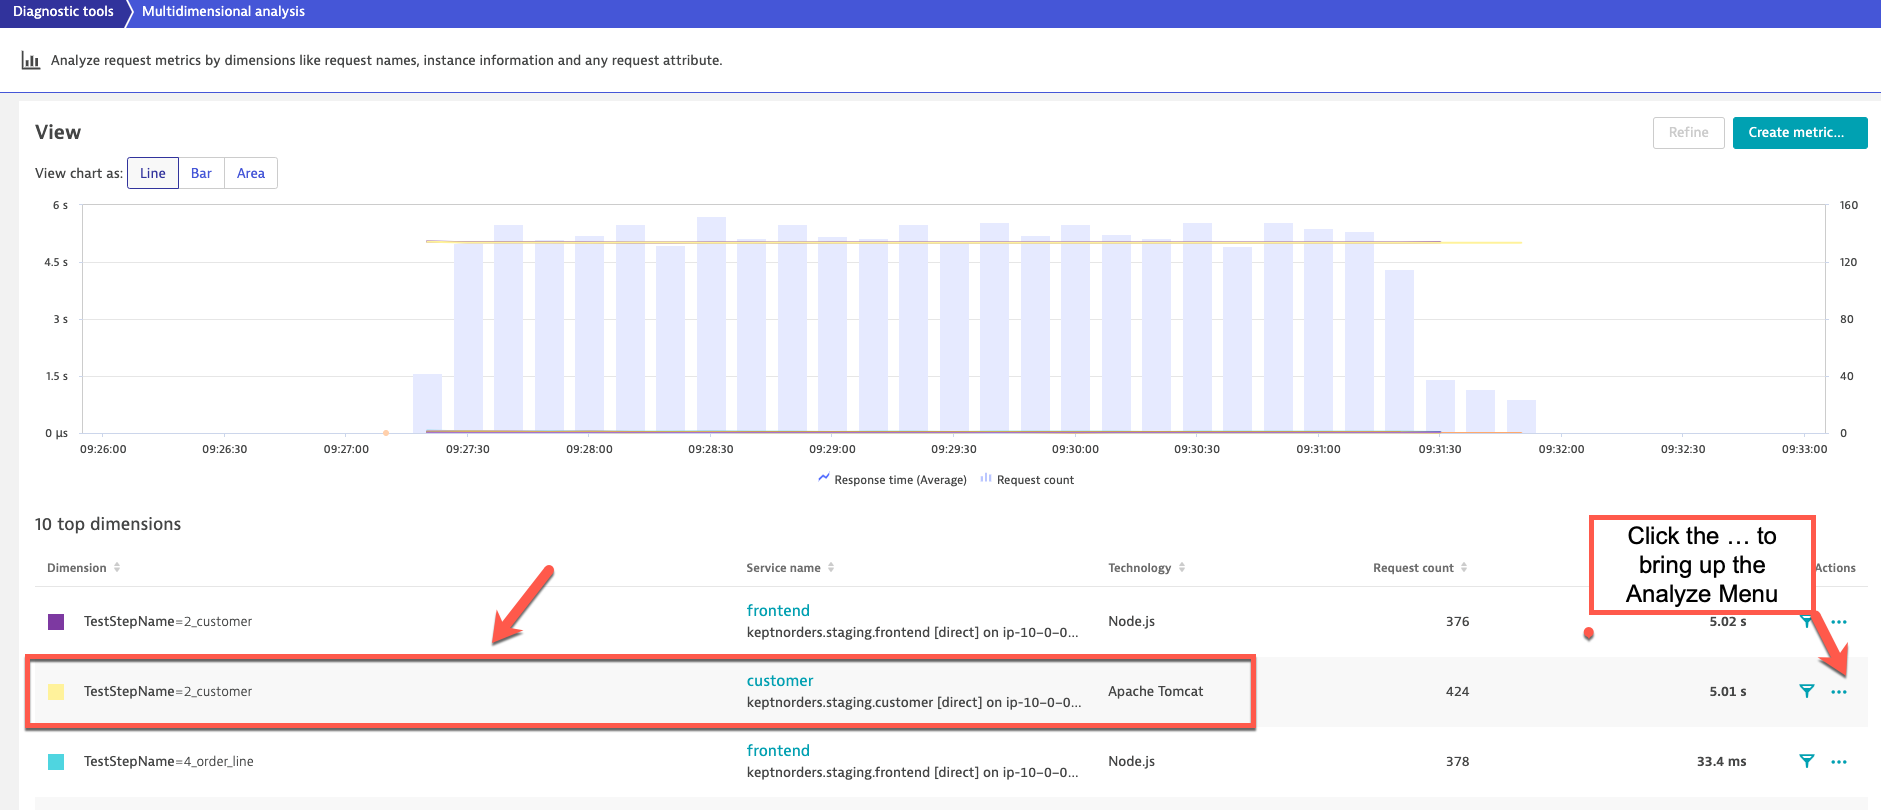
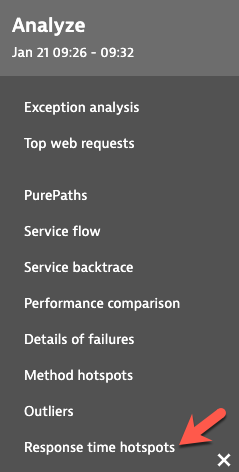
Click on the … at the end of the table for “customer” step name transaction which will bring up the “Analyze” menu.
Click “Response time hotspots” from the Analyze menu.
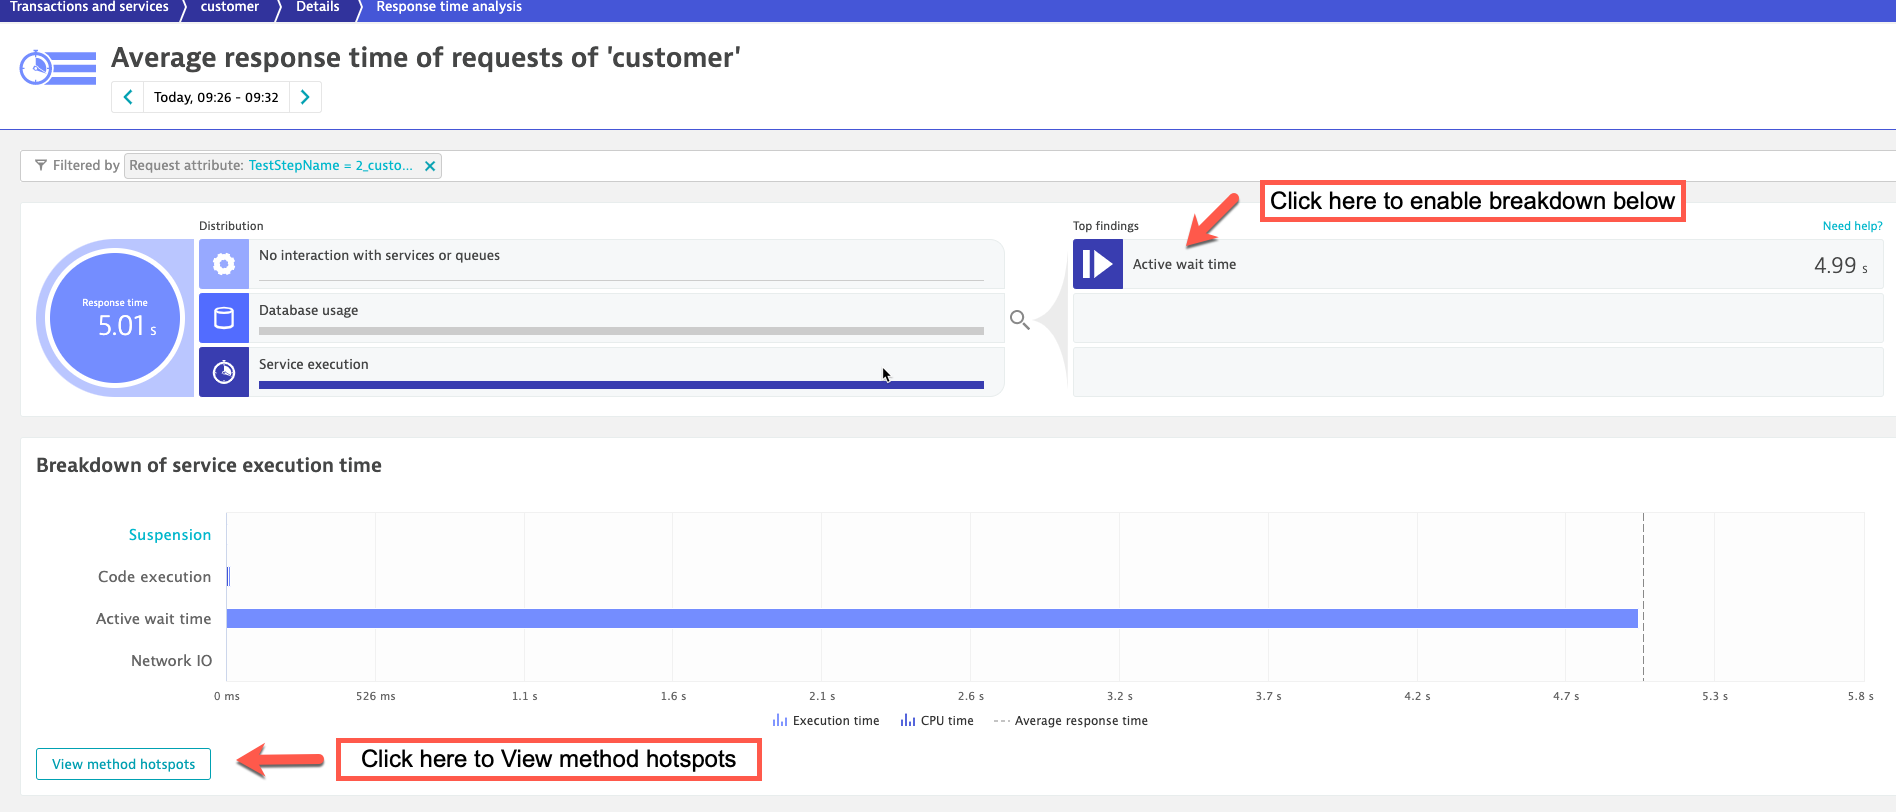
On the Response time analysis page it will display the average response time observed during the analyzed timeframe. On the left side of the infographic, under Distribution, you can see how much time is contributed by calls to other services, calls to databases, and code-level execution. On the right side, under Top findings, we list the biggest hotspots identified by Dynatrace. You can click any of these entries to view further details.
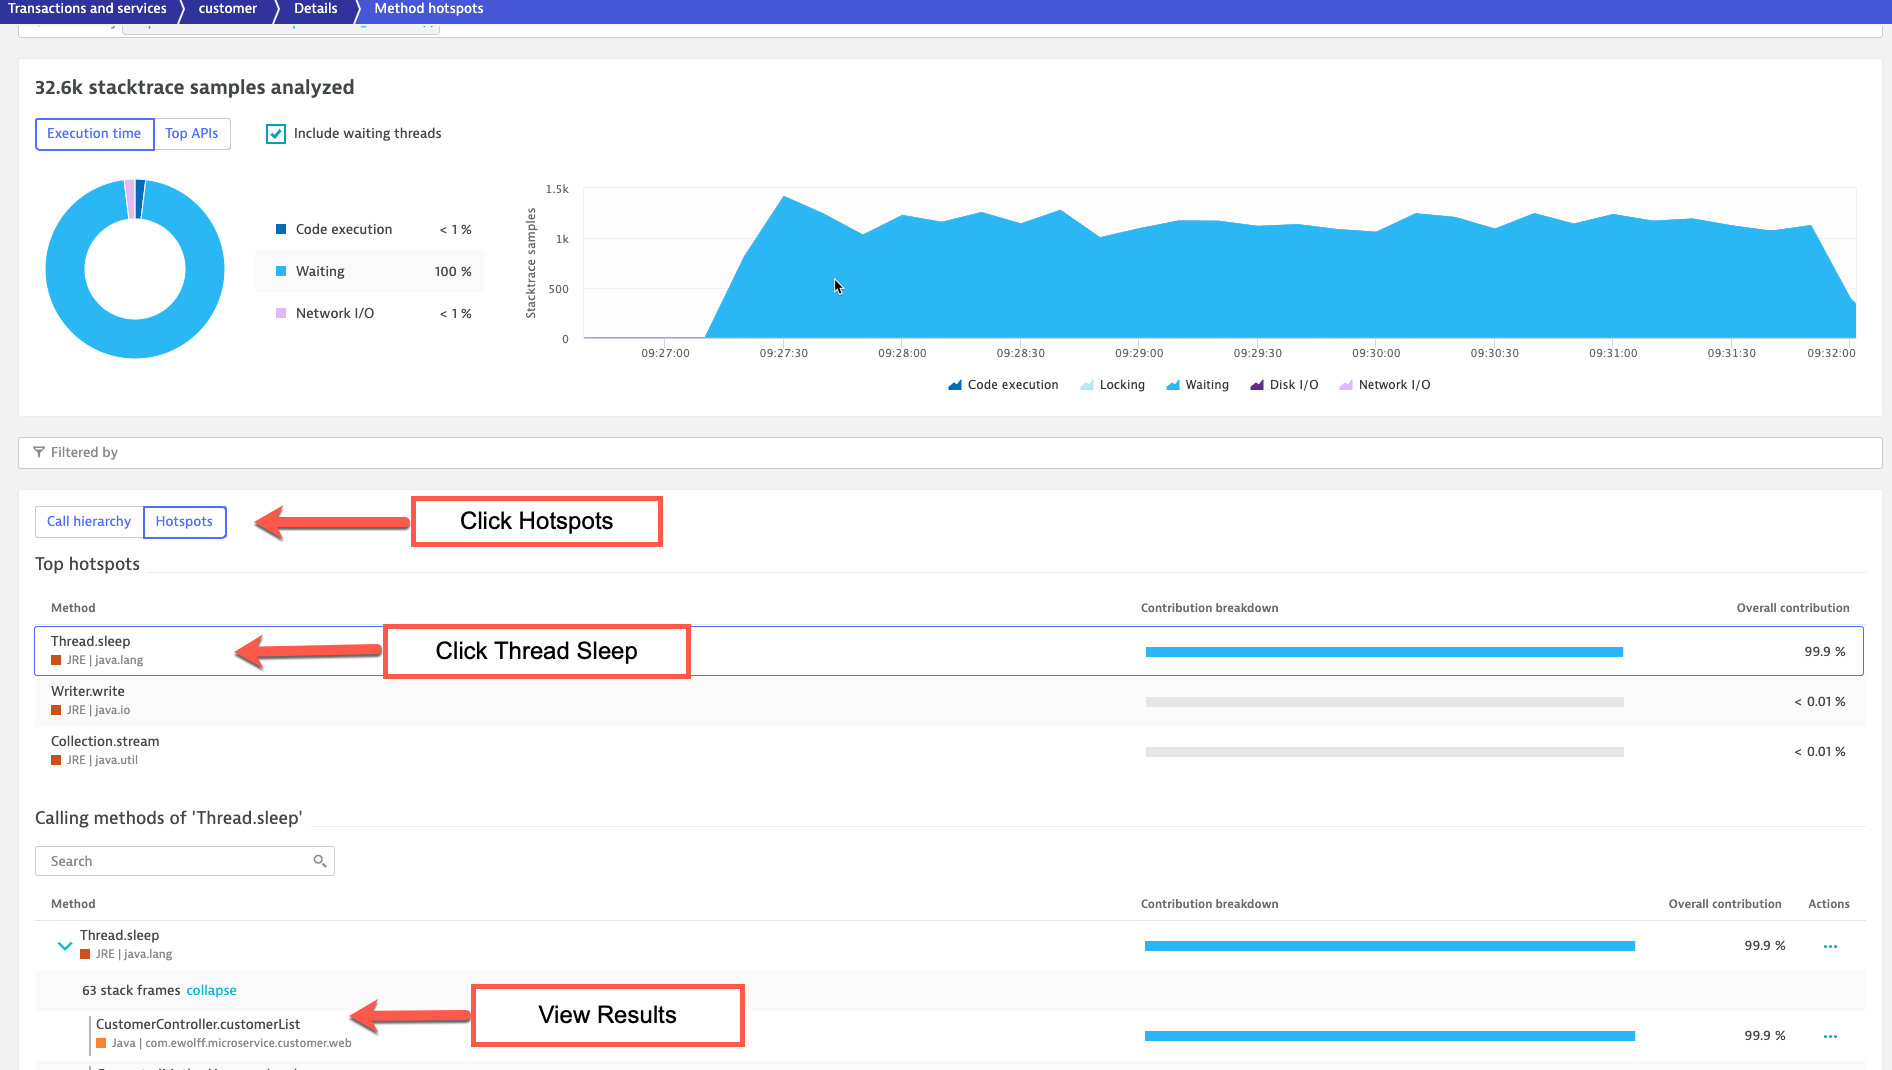
Within the current screen click on View method hotspots button which will drill to the Method hotspots.
In the Method hotspots screen click on Hotspots button. This will change the view to the Top hotspots. Click expand in the method call tree and you can see the method that is calling the top hotpot in the code.
Summary
- We learned how to create a Process Detection Naming rule to change out of the box detected names
- We learned how the use the Dynatrace Service Flow for Architecture Validation
- We learned what a x-dynatrace-test request header is, how to use it in your Performance testing tool and the importance for improving of your Performance Test Analysis
- We learned what a Dynatrace Load Test Request Attribute is, how to use it, and the importance for improving of your Performance Test Analysis
- We learned what a Dynatrace Calculated Service Metric is, how to use it, and the importance for improving of your Performance Test Analysis
- We covered the Performance Test Dashboard with Transaction Steps and how you can use it for improving of your Performance Test Analysis
- We learned how to analyze Performance Test issue within Dynatrace and get to root cause in minutes