Analysis in Dynatrace
If time permits during our session we have created a few more exercises/topics to cover.
See below:
- Request Naming Rule
- Custom Alert
- Performance Analysis
- Compare Results of Two Test Runs
Request Naming Rule
Within Dynatrace, you can use request naming rules to adjust how your requests are tracked and to define business transactions in your customer-facing workflow that are critical to the success of your digital business. With such end-to-end tracing, Dynatrace enables you to view and monitor important business transactions from end to end.
For the order service, we want to change the discovered transaction names to use the LSN request attribute that has the Test Step Name you use in your load test product when running Performance Tests.
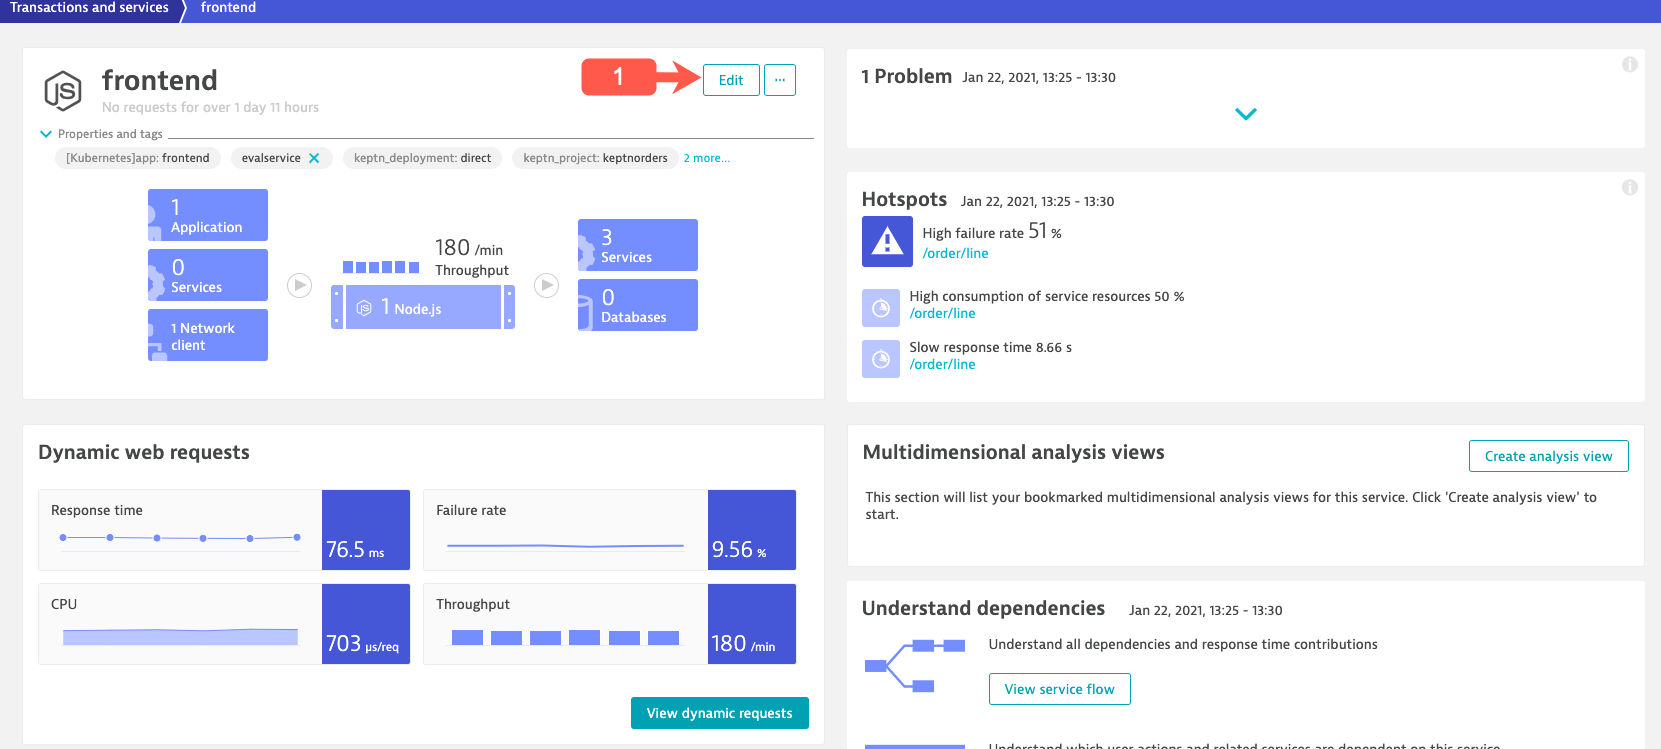
At the top of the order services page and choosing the edit option as shown below.
Within in the service settings, navigate to Web request naming and click the Add rule button
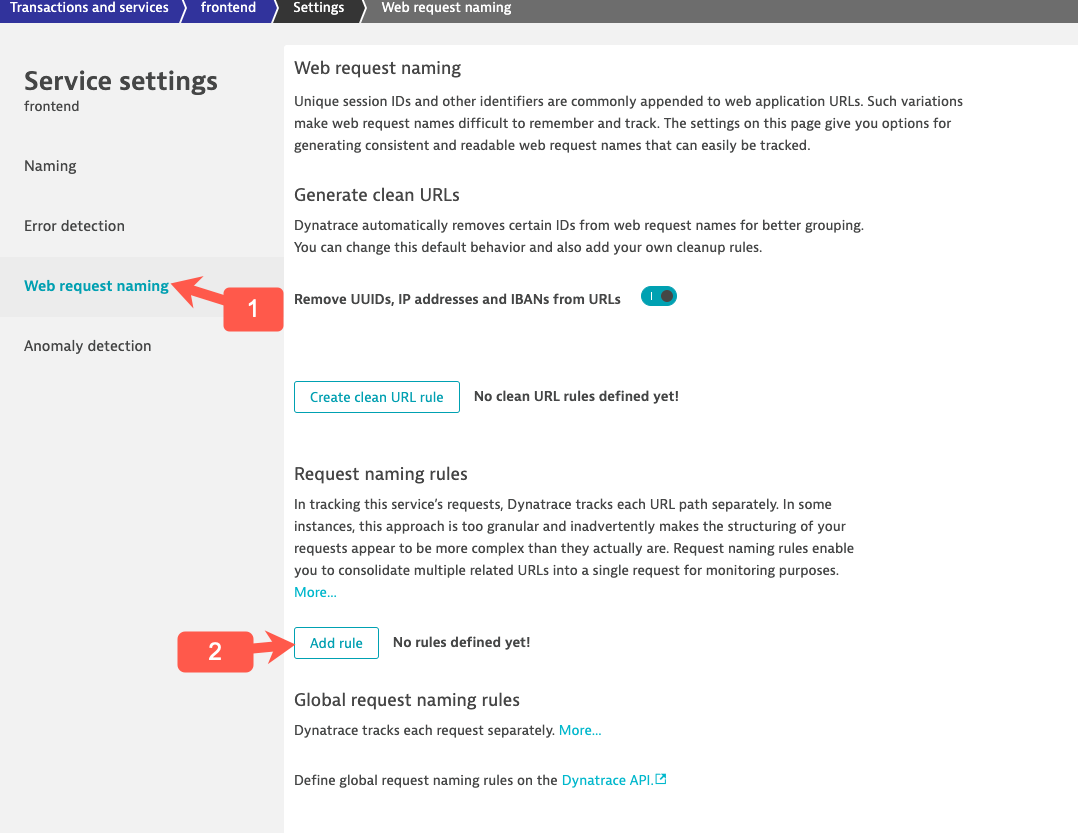
Below are the settings we want to use:
- naming pattern = {RequestAttribute:LSN}
- conditions = {RequestAttribute:LSN} exists
- click the Preview Rule button to verify.
It should look like this:
—Placeholder screenshot—
Custom Alert
A custom alert provides a simple way of defining a threshold on a given metric. Dynatrace sends out alerts when a metric breaches a user-defined threshold. You can define alerts for when actual metric values are above or below the user-defined threshold. Because a metric can be recorded by multiple components within your environment, Dynatrace always alerts with a reference to the component that shows the violating metric.
We are going to cover how to create a Customer alert based on response time for your Test Step transactions.
Go to “Settings>Anomaly detection>Custom events for alerting” and then select Create custom event for alerting.
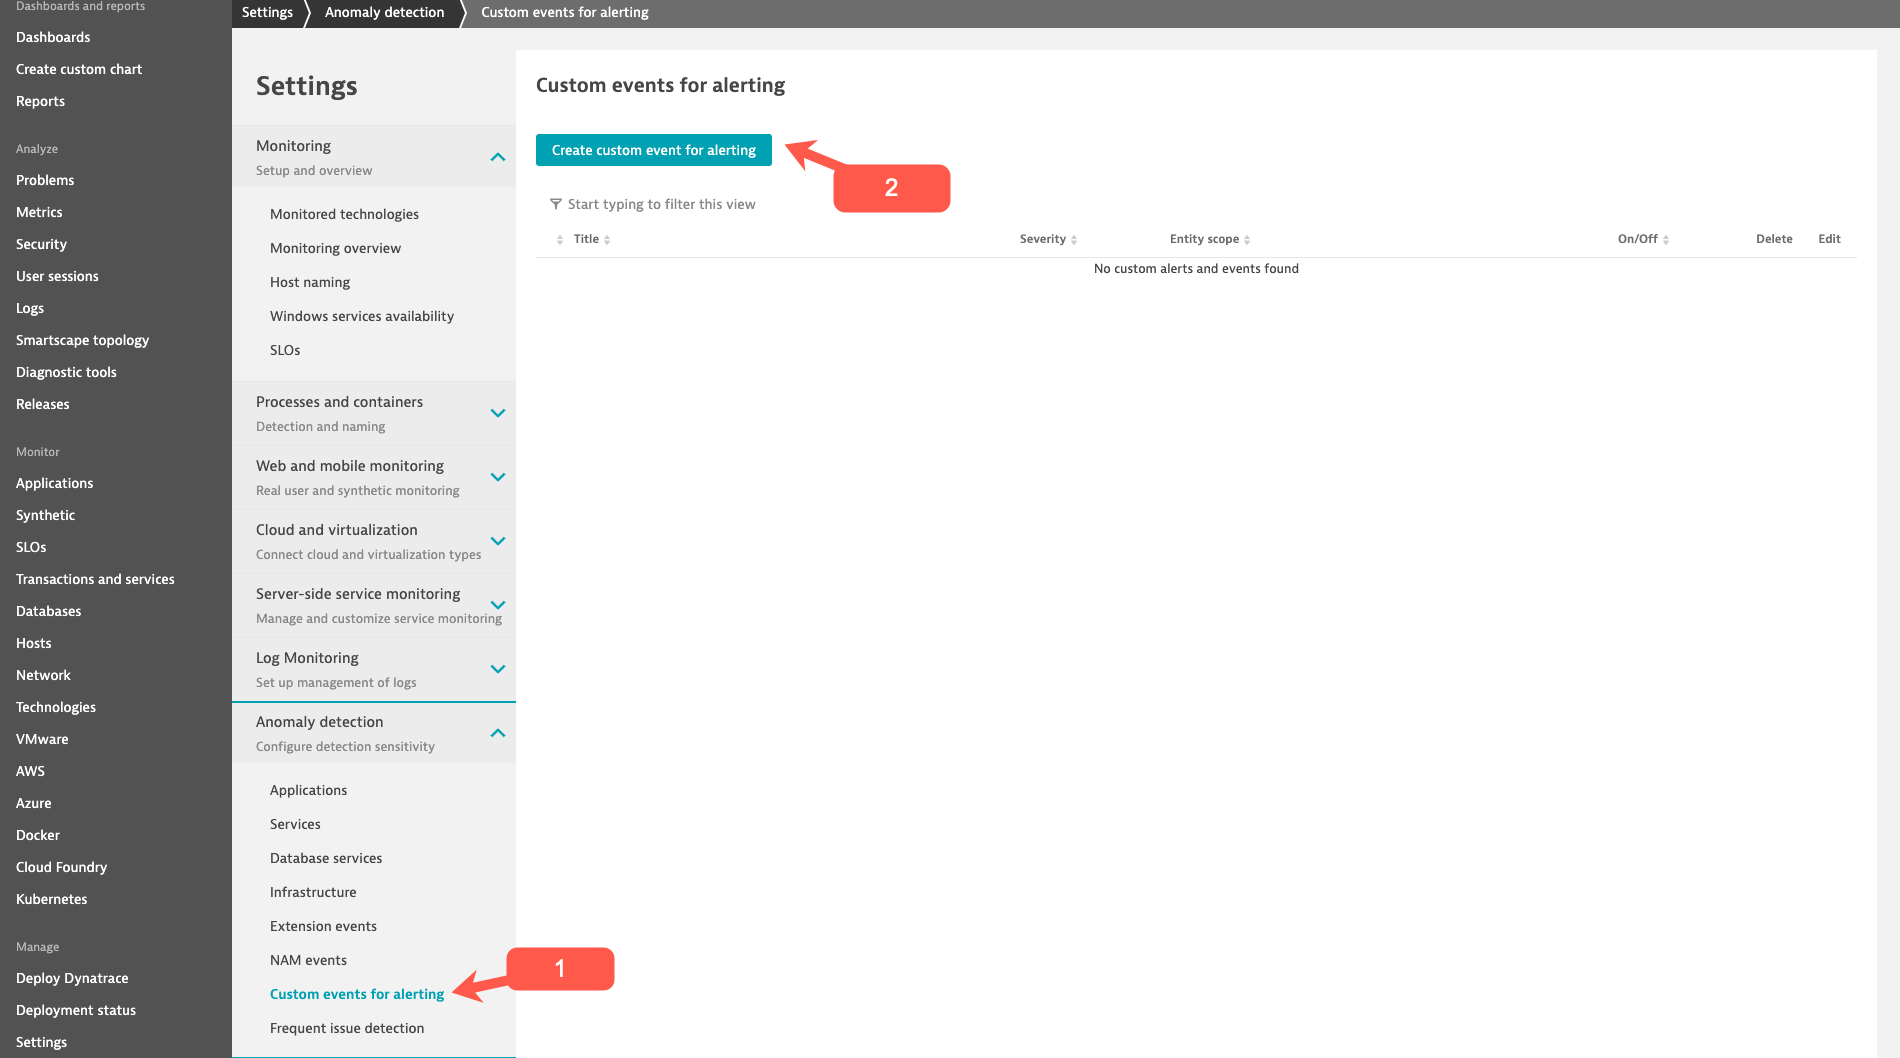
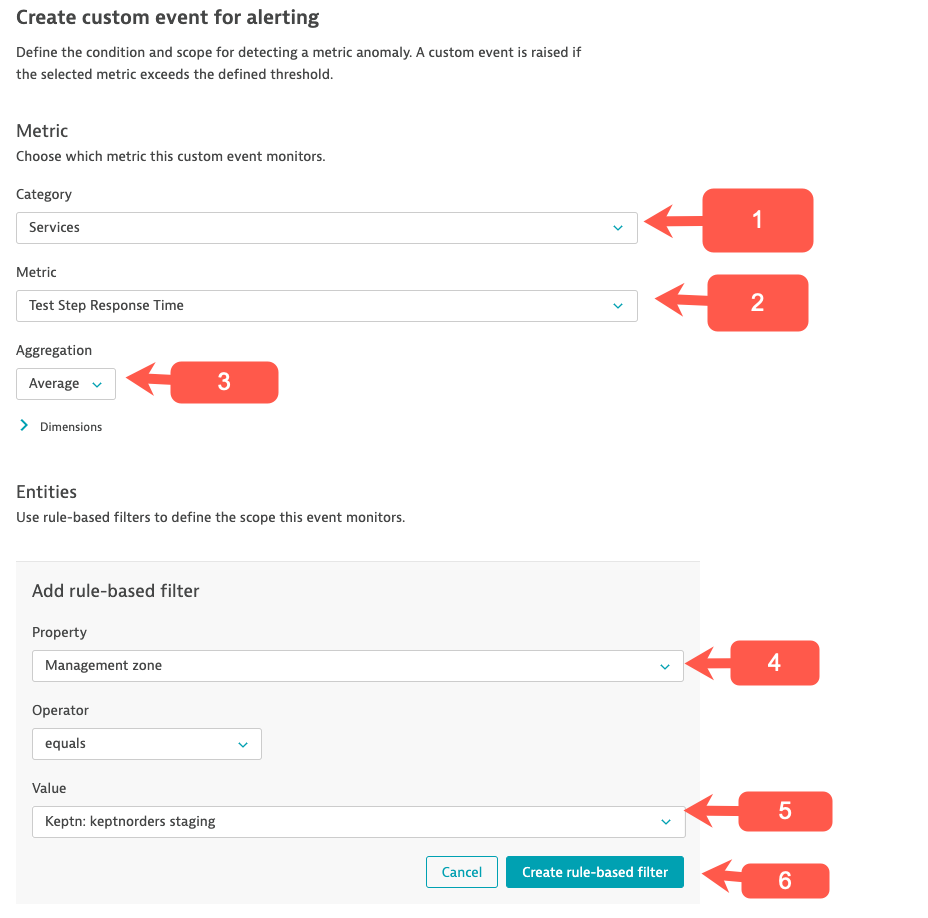
The will bring you to the Create custom event for alerting screen.
In the Metric section use the following settings:
- Category dropdown pick: Services
- Metric dropdown pick: Test Step Response Time
- Aggregation keep the default which is Average
In the Entities section click Add a rule base filer
We will use the following settings:
- Property dropdown pick: Management zone
- Operator dropdown pick: Exists
- Value dropdown pick: Keptn: keptnorders staging
When finished, select the Create rule based filer
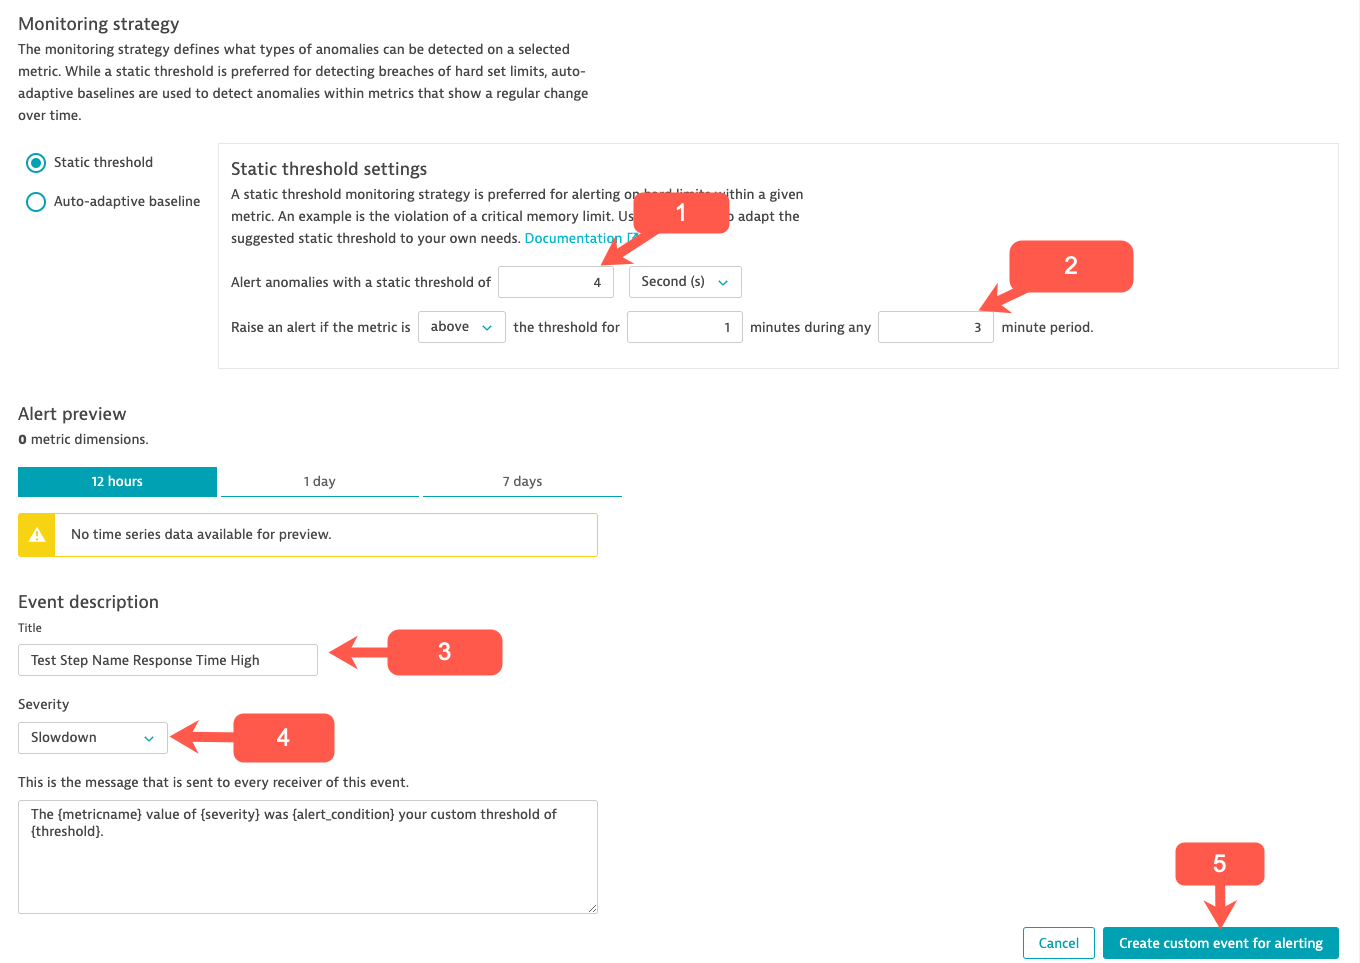
In the Monitoring strategy section we will use the following settings:
- Keep the default which is Static threshold.
In the Static threshold settings section use:
- 4 seconds
In the Event description section we will use the following settings:
- Title use: Test Step Name Response Time High
- Severity dropdown pick: Slowdown
When finished, select the Create custom event for alerting button. This will create your custom alert.
We need to run a Load Test so we can review the Problem that gets generated from the custom alert you setup.
Performance Analysis
We will cover another troubleshooting example via an out of the box workflow for a key service that has been impacted during the Performance Test.
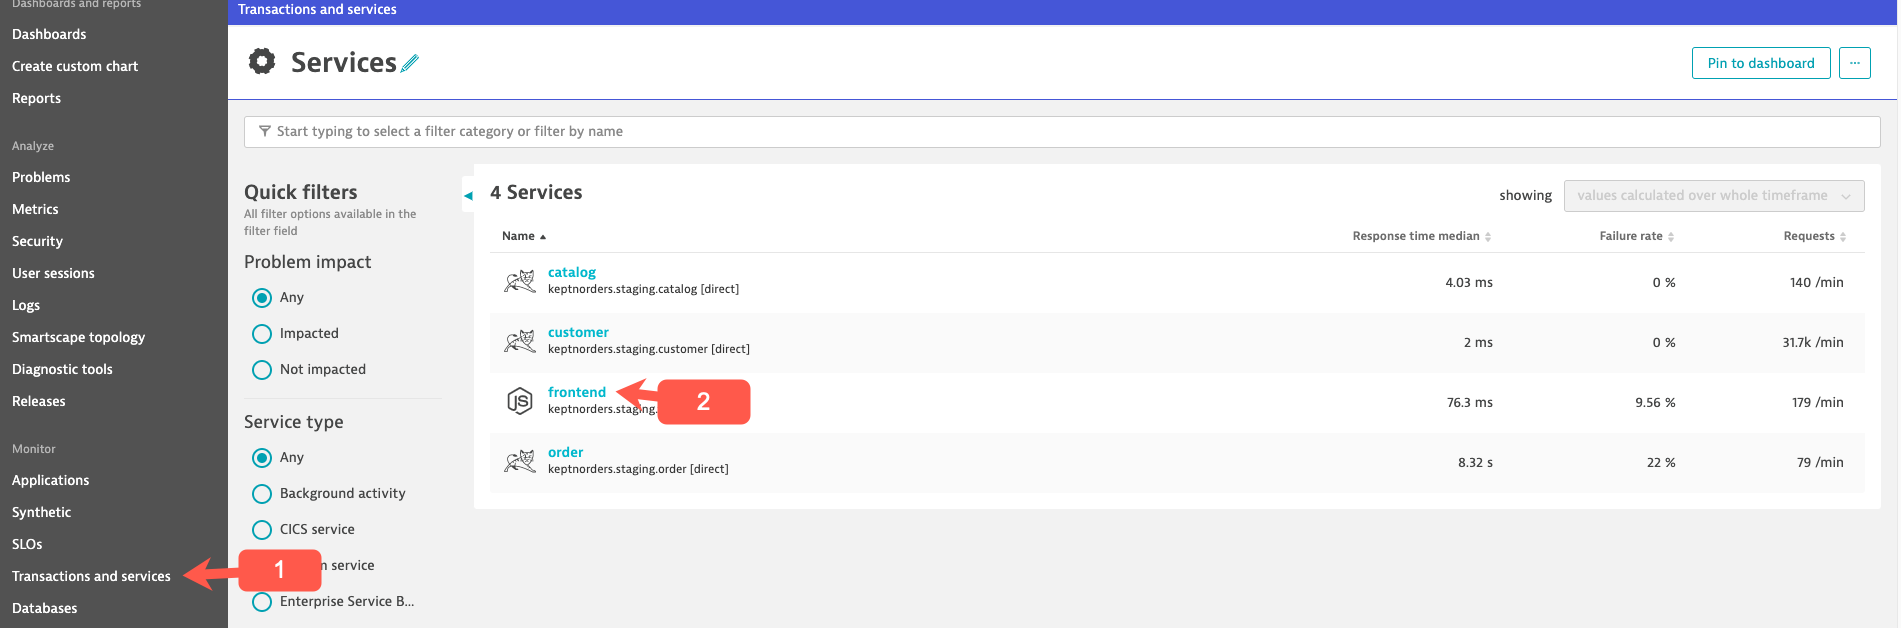
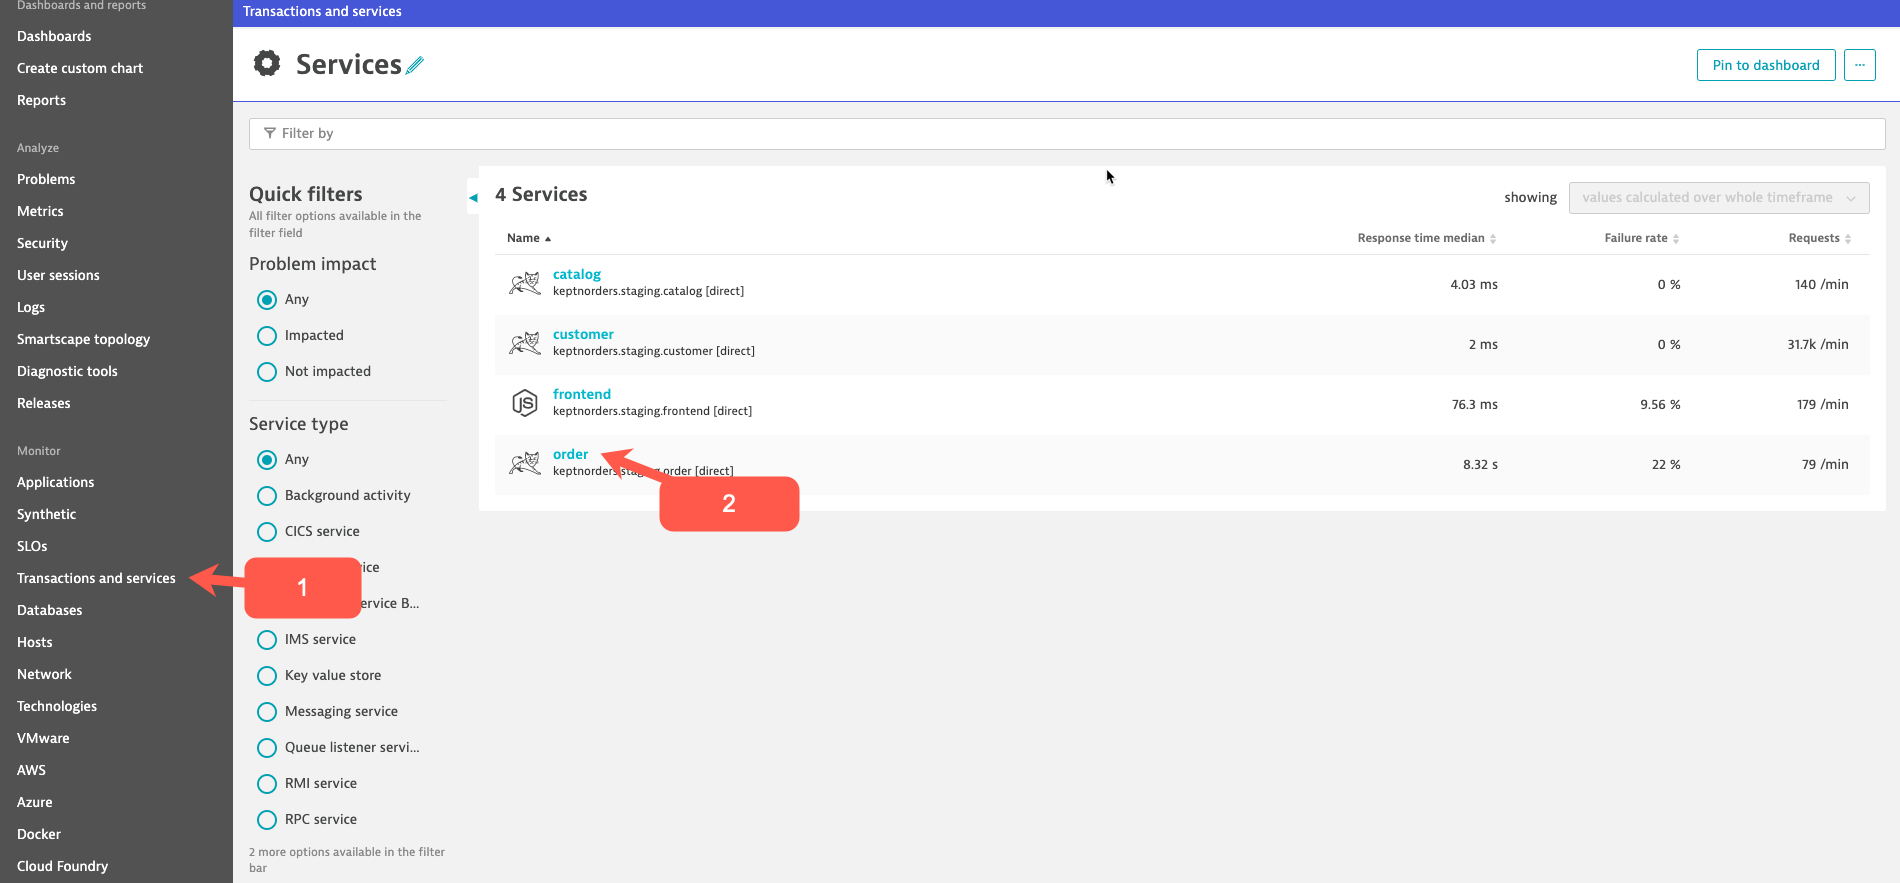
Click “Transactions and services” from the Main Navigation menu.
Then click on the Order service in the Services screen.
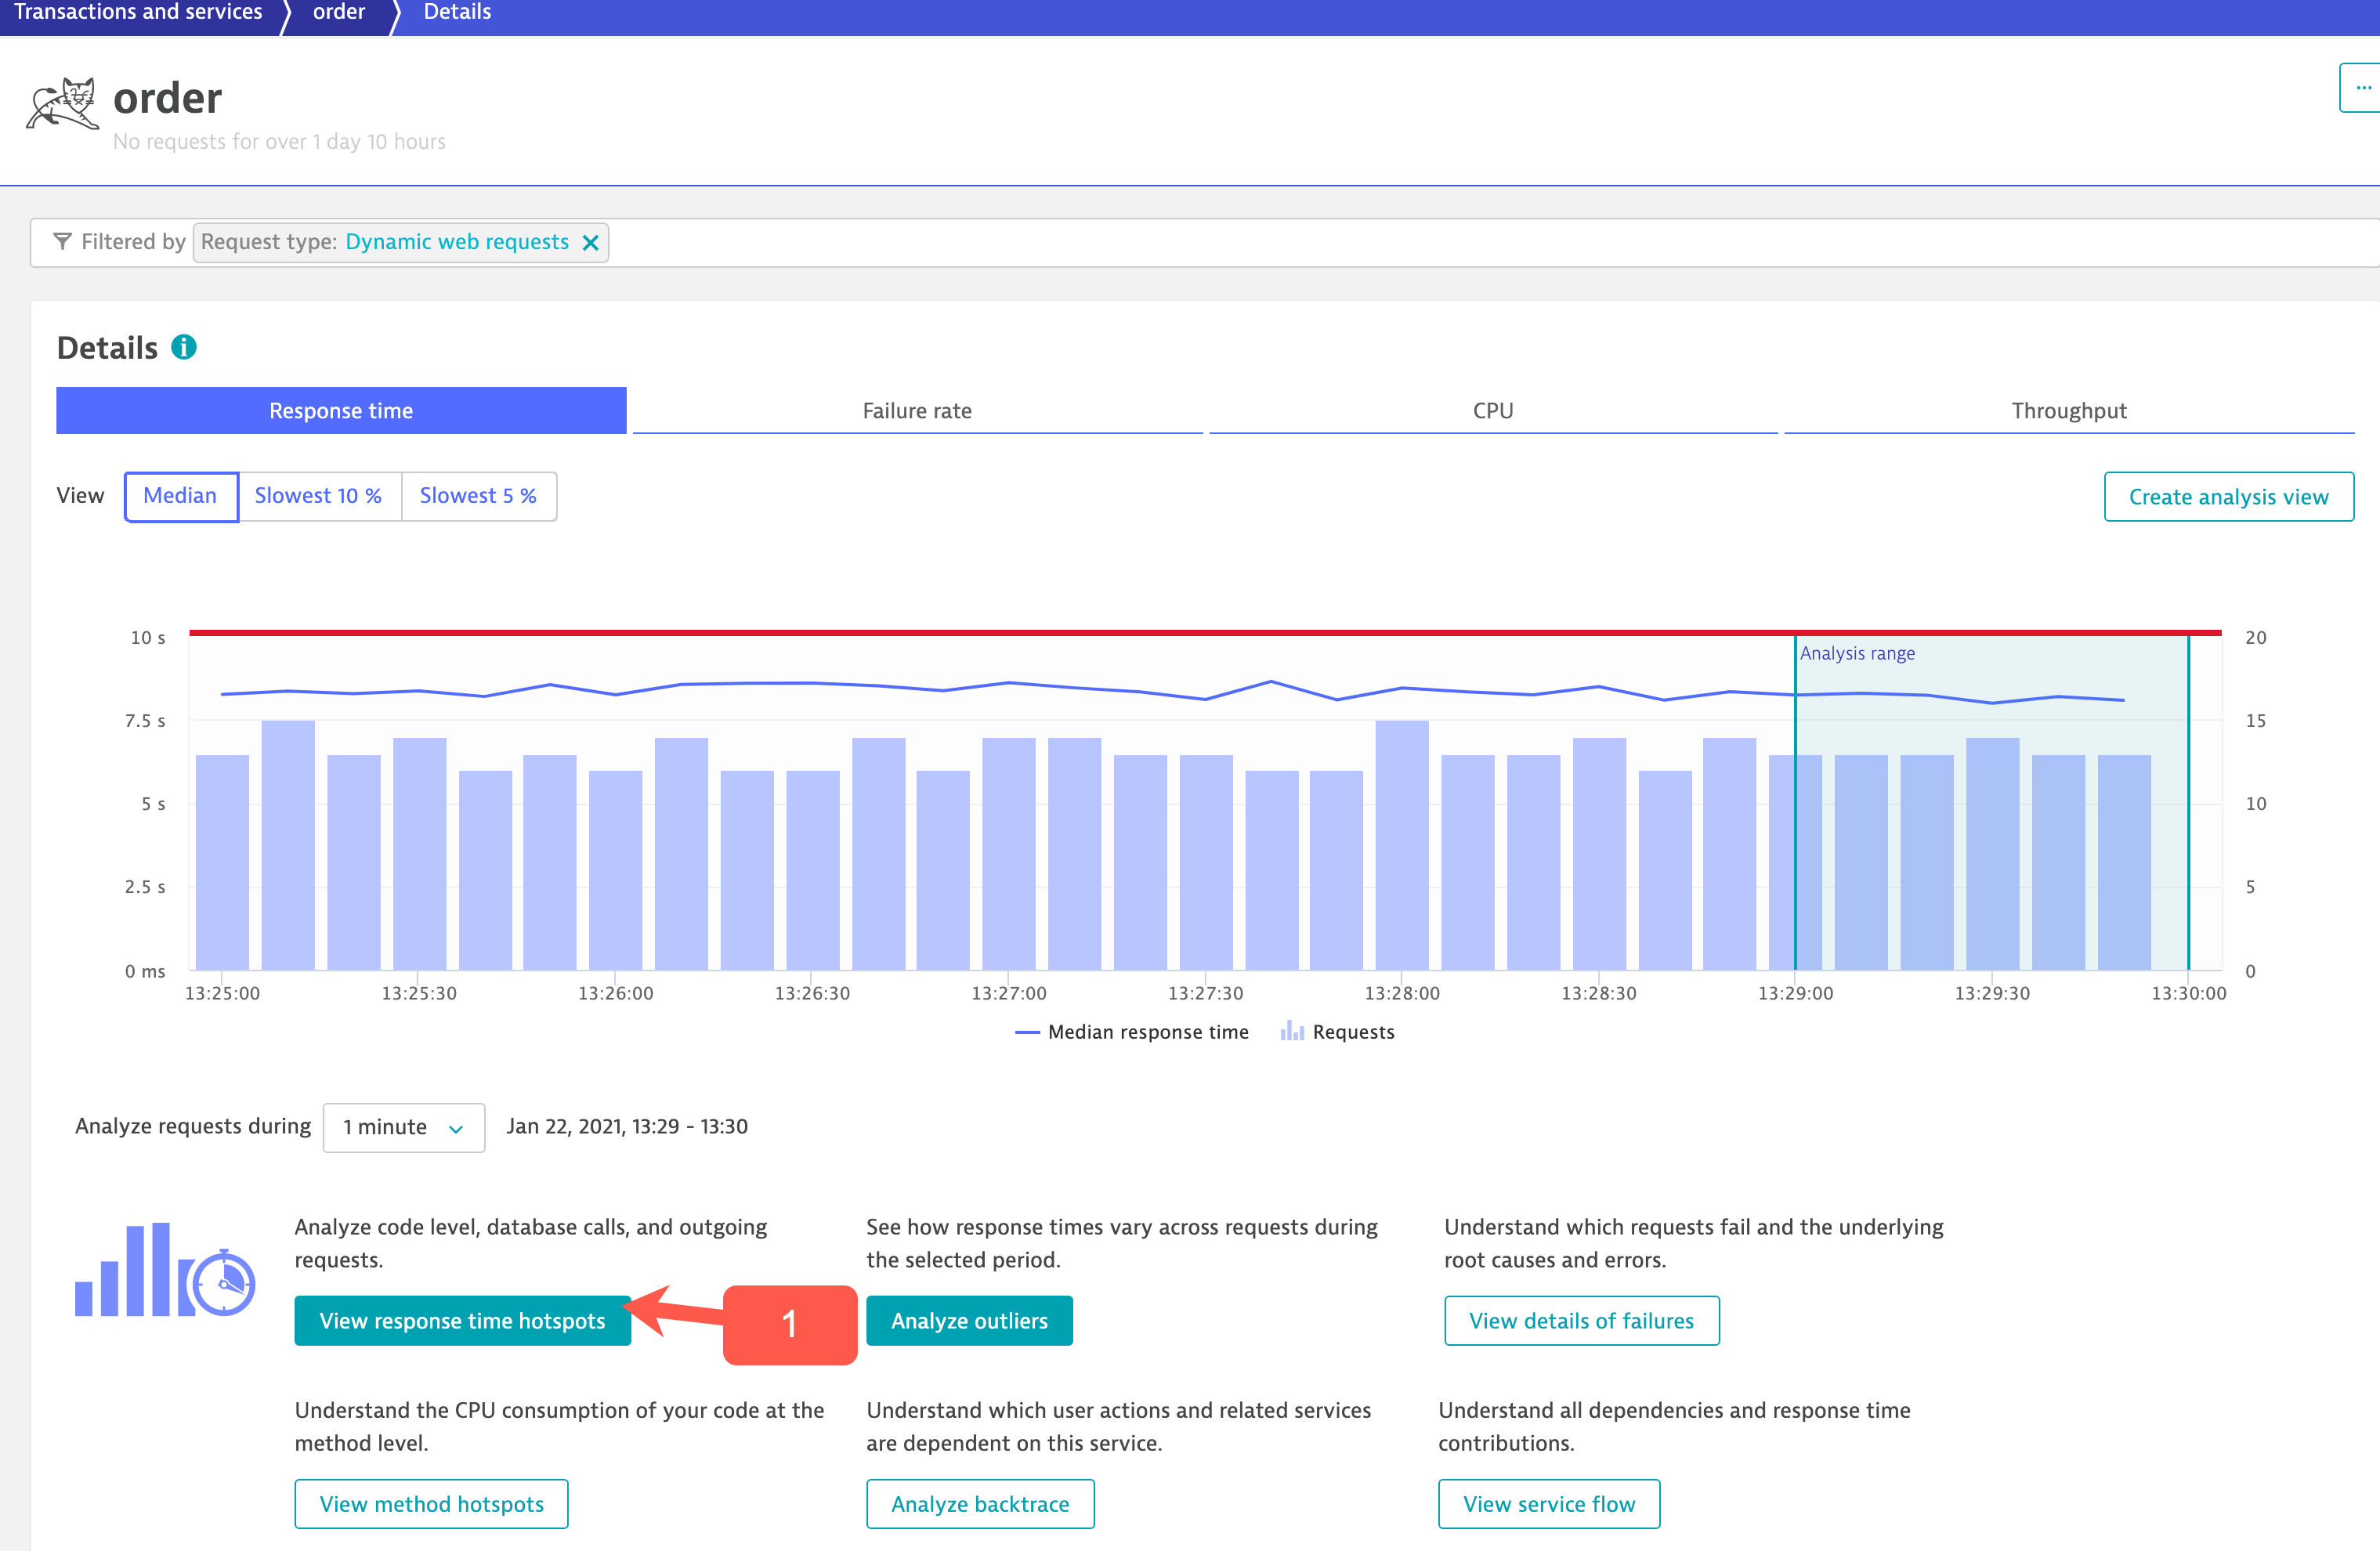
This will bring up the Order Service overview screen. Under Dynamic web requests section (charts) click the Response time section.
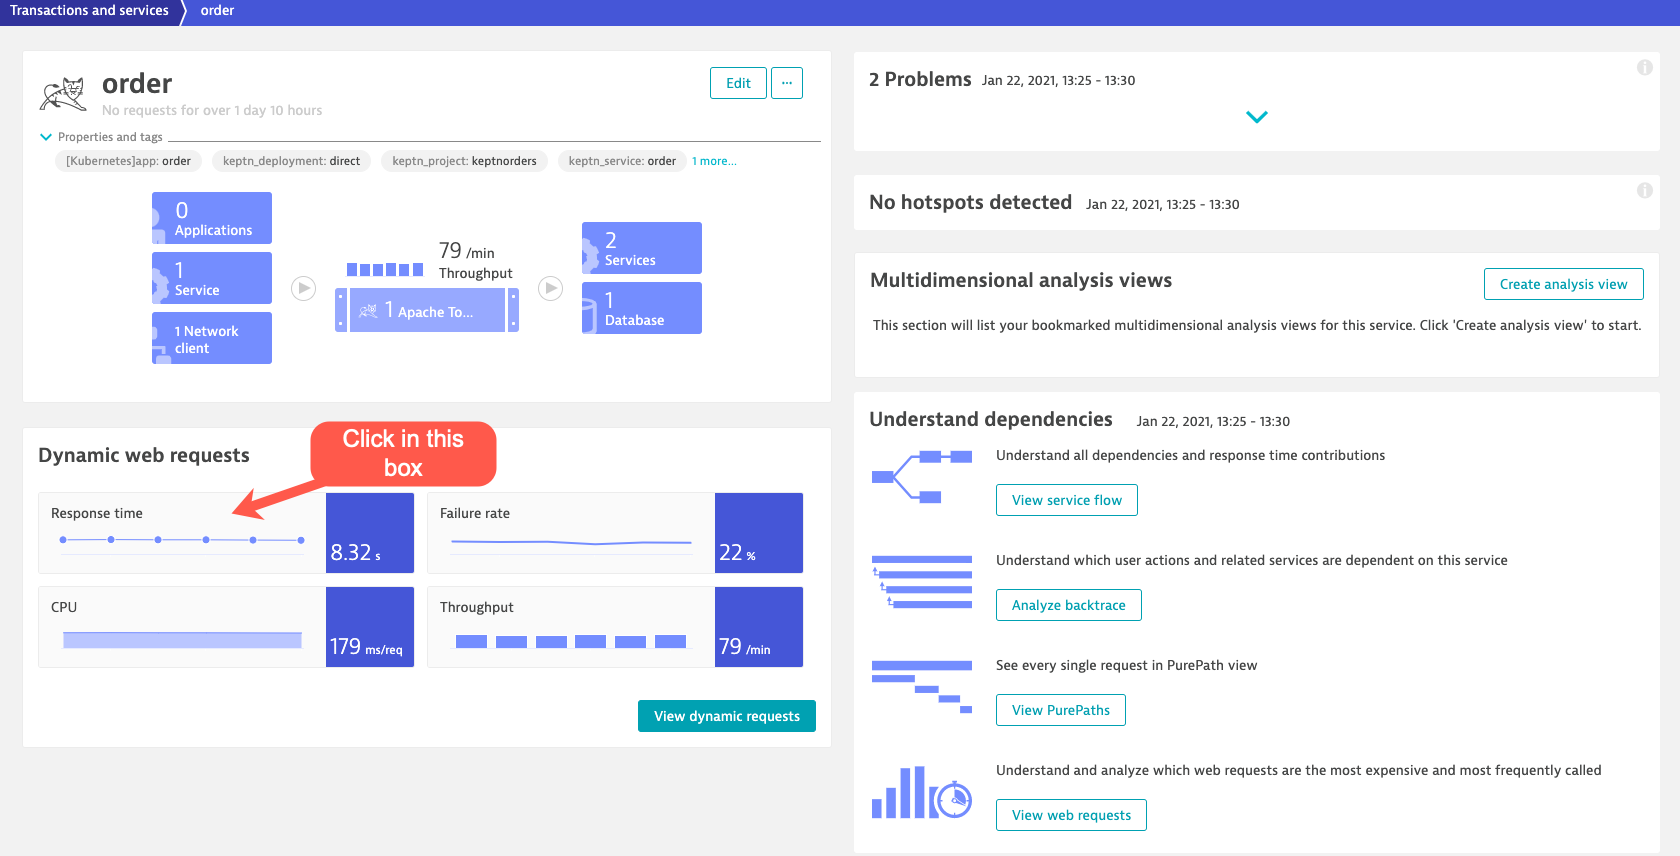
This will bring up the Order Service Response time screen. Click the View details response time hotspots button.
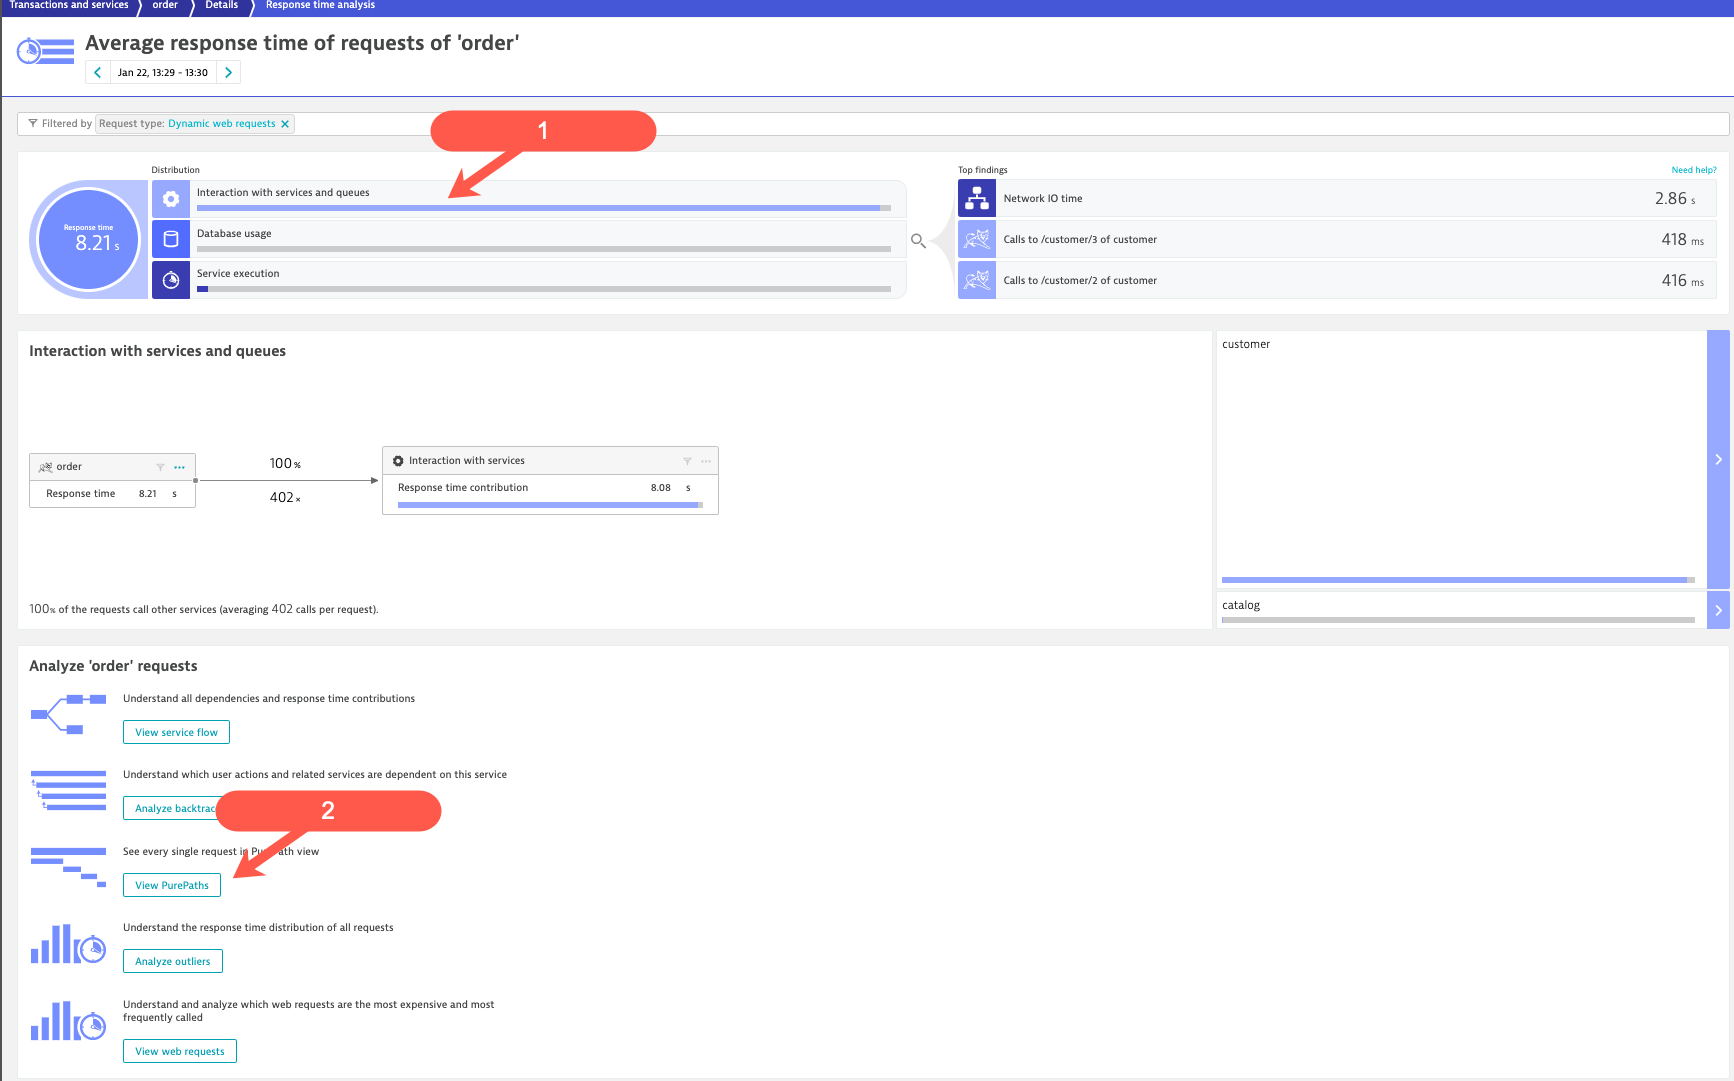
This will bring us to the Response time analysis screen. We can see Average response time, Distributions and Top findings.
In the Distributions section click the Interactions witt services and queues.
To dig deeper you can drill-down to the Purepaths by click on the Purepaths button at the bottom of the screen under the Analyze ‘order’ requests section*.
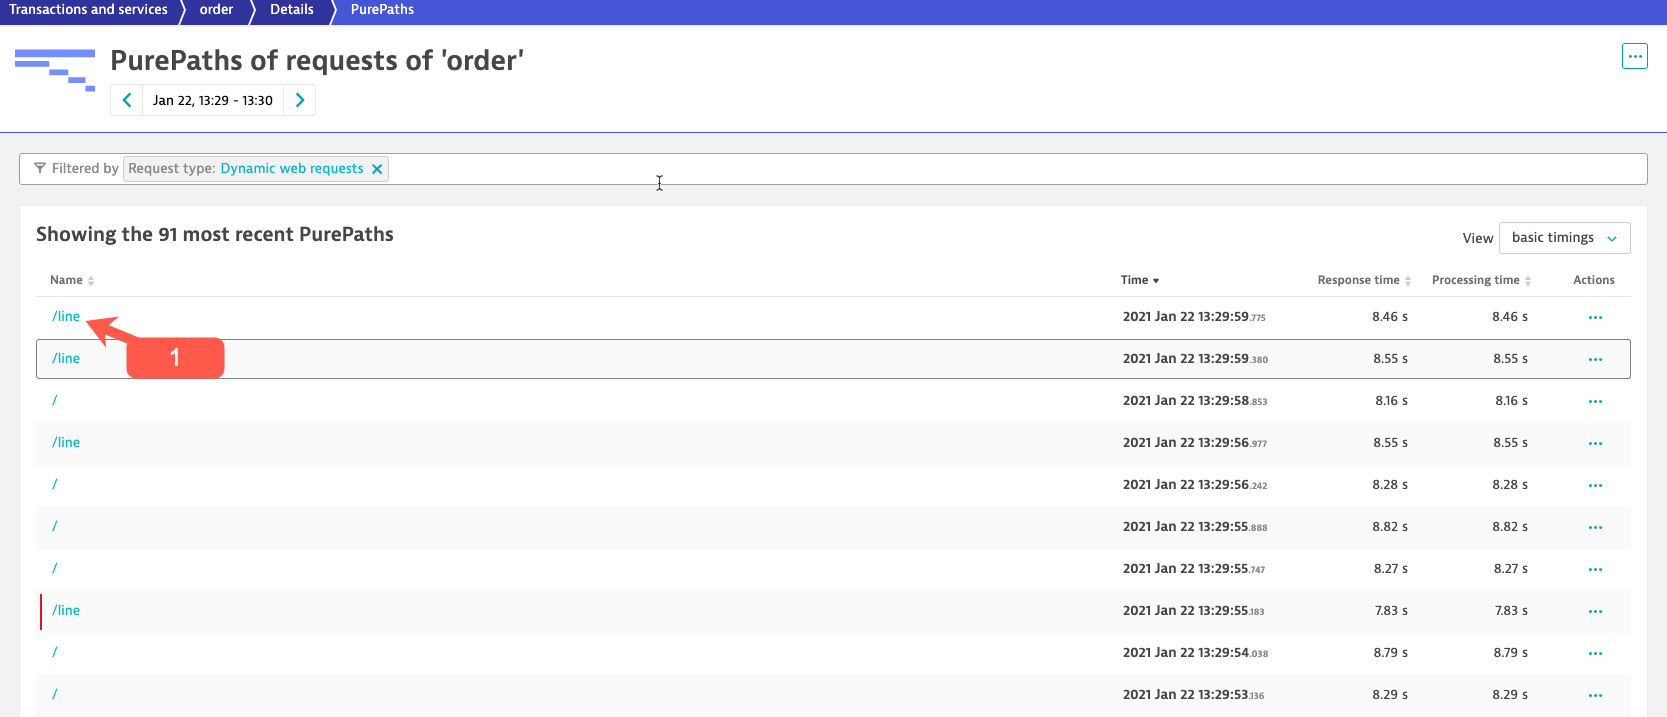
This will bring us to the slow Purepaths. Click on a Purepath to see the trace details Dynatrace has captured around the slow transaction.
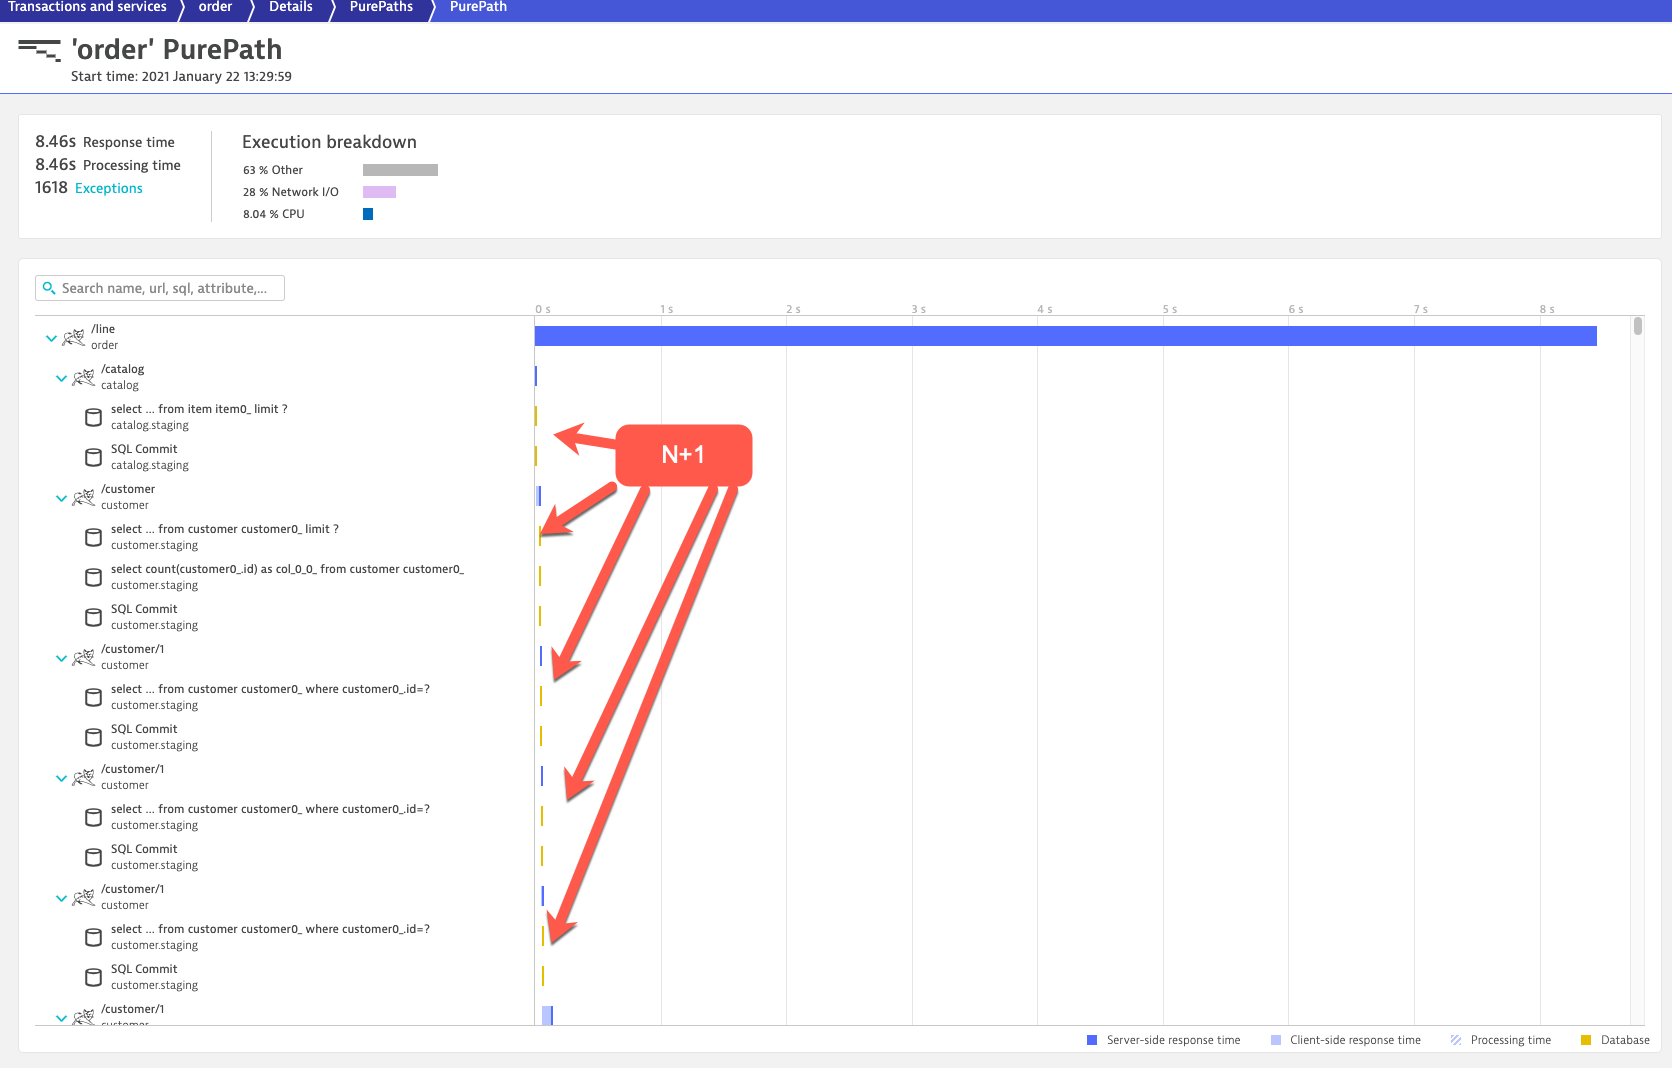
This will bring us to the Purepath trace details screen. Reviewing the puepath details we quickly see an high number of queries are being executed by the customer service over and over.
This is a N+1 issue!! This is inefficient at that transaction level but can also kill your database and impact other transactions.
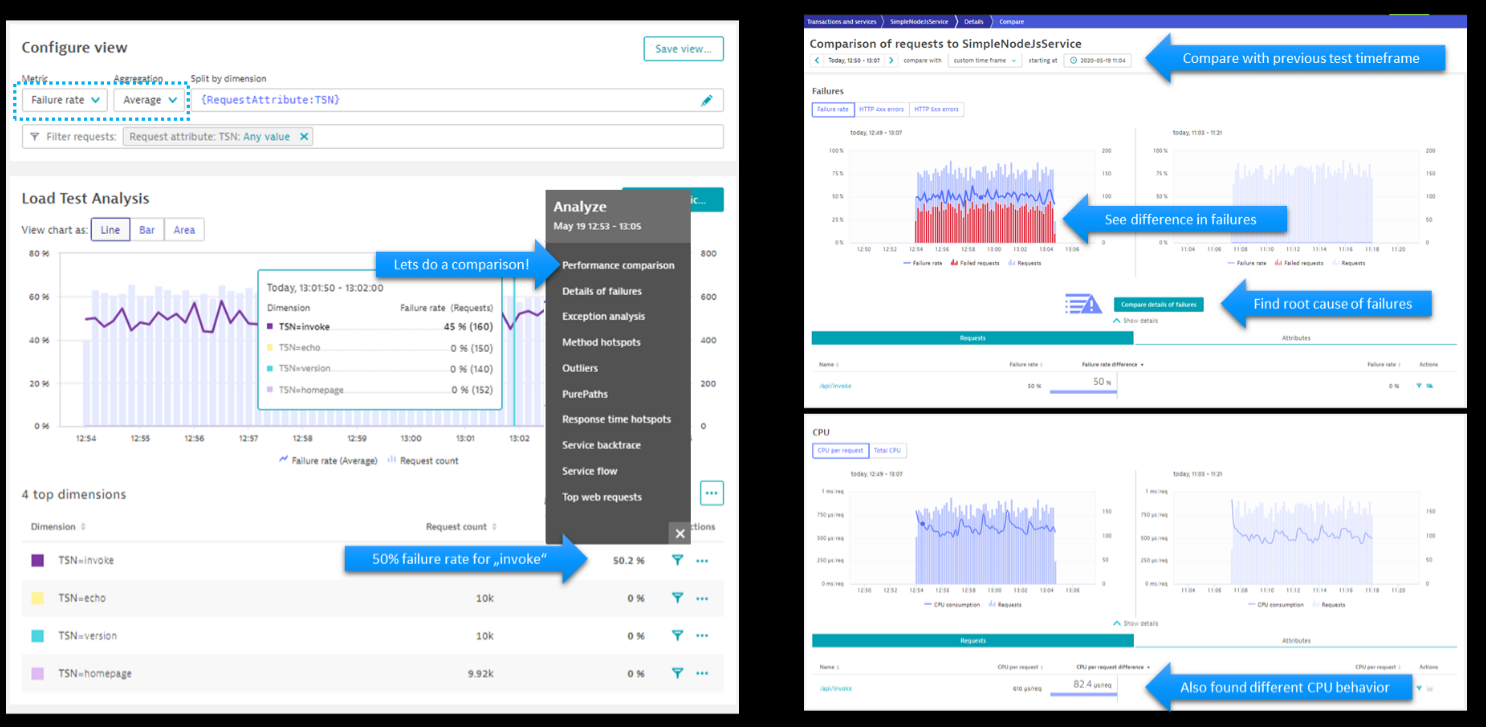
Compare Results of Two Test Runs
Analyzing one test run is great, but comparing two is better as we want to know what the difference between two test runs really is.
In this example a new deploy for version 2.0.0 of a node.js sample application that had some issues where requests to one of the api endpoints has a high failure rate.
Focusing on “Average Failure Rate split by Test Names” and comparison with the previous test.
Summary
- We learned how to rename transactions using web request naming rules
- We learned how to how to create a custom alert
- We showed another example how to analyze a Performance Test
- We learned how to compare results from two different Performance tests